Home » SWICo Papers (Page 2)
Category Archives: SWICo Papers
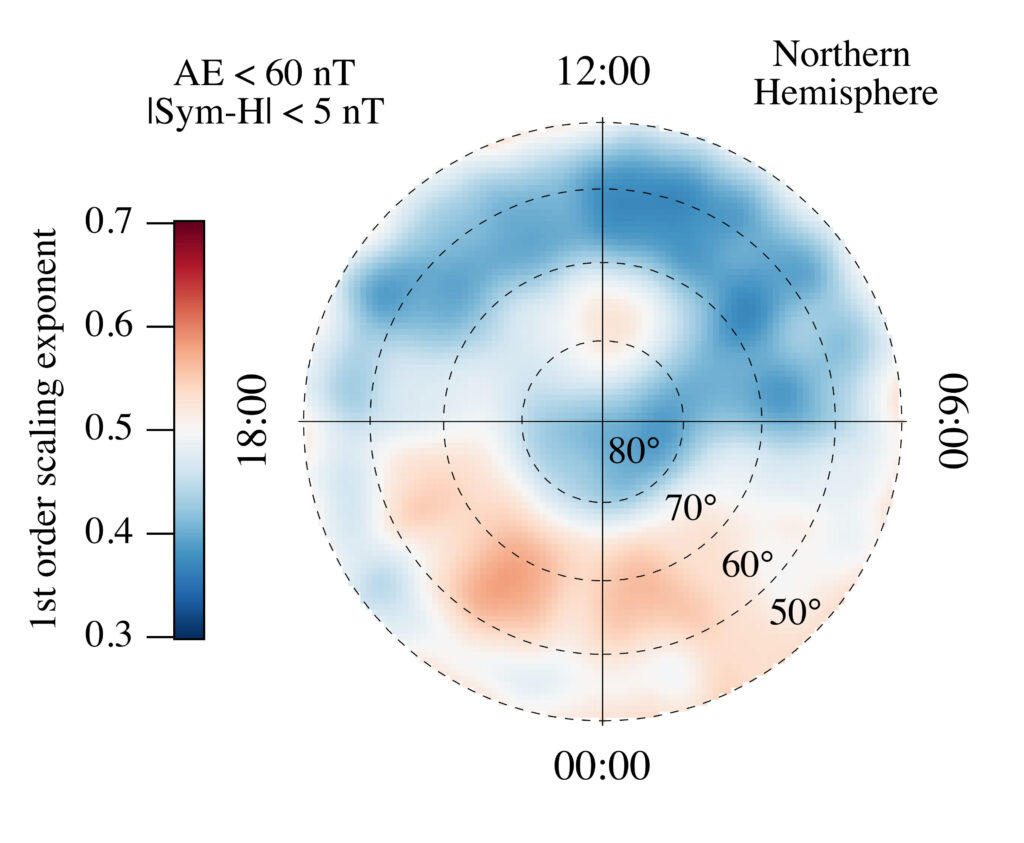
High-latitude polar pattern of ionospheric electron density: Scaling features and IMF dependence
Papers from SWICo members
G. Consolini, R. Tozzi, P. De Michelis, I. Coco, F. Giannattasio, M. Pezzopane, M.F. Marcucci, and G. Balasis.
We used electron density measurements over a period of 15 months from April 1, 2014 to June 30, 2015, from ESA Swarm A satellite, and computed the related 1st and 2nd order scaling exponents of the q-th order structure function.
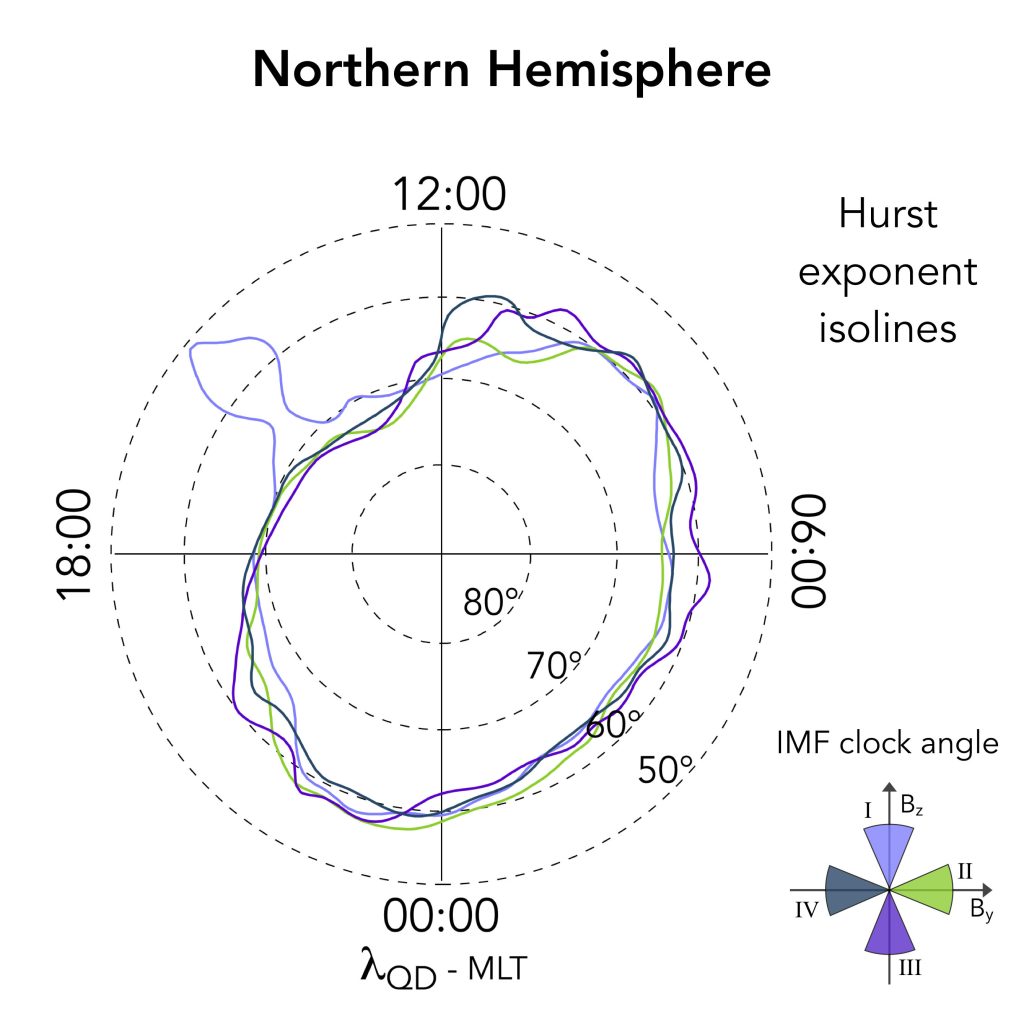
We mapped them as a function of magnetic latitude and local time for four main orientations of the Interplanetary Magnetic Field under conditions of high solar activity (average solar radio flux – F10.7 – index equal to 140 ± 30 sfu, during the considered period). On the whole, the found patterns of the electron density 1st and 2nd order scaling exponents suggest the occurrence of turbulence at the high latitudes.
Publication: G. Consolini, R. Tozzi, P. De Michelis, I. Coco, F. Giannattasio, M. Pezzopane, M.F. Marcucci, and G. Balasis, High-latitude polar pattern of ionospheric electron density: Scaling features and IMF dependence, Journal of Atmospheric and Solar-Terrestrial Physics, 2021. https://doi.org/10.1016/j.jastp.2020.105531
Parallel electrical conductivity in the topside ionosphere derived from Swarm measurements
Papers from SWICo members
F. Giannattasio, P. De Michelis, A. Pignalberi, I. Coco, G. Consolini, M. Pezzopane, and R. Tozzi.
About four years of plasma data (electron density and temperature) from the ESA Swarm A satellite has been used to compute the ionospheric electrical conductivity parallel to the geomagnetic field, with the purpose of climatologically characterize a fundamental parameter involved in the formation and evolution of the field aligned currents. Variations as a function of magnetic latitude, local time and season are examined and the average effect of particle precipitation is evaluated by subtraction of the background conductivity by using the IRI model.
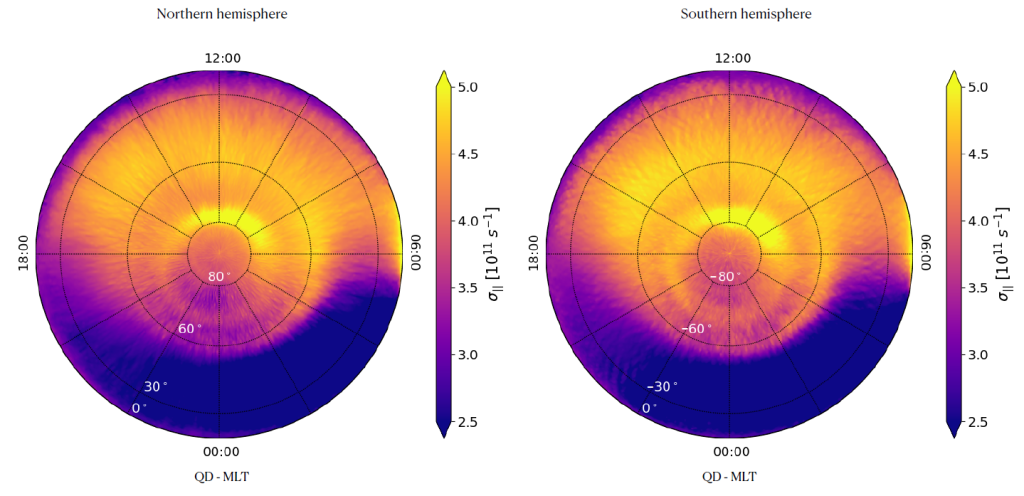
The results overall agree with previous literature, but also evidence interesting unexpected features, such as, for examples, marked asymmetries in the conductivity distributions between Northern and Southern hemispheres.
Publication: F. Giannattasio, P. De Michelis, A. Pignalberi, I. Coco, G. Consolini, M. Pezzopane, and R. Tozzi, Parallel electrical conductivity in the topside ionosphere derived from Swarm measurements, J. Geophys. Res.: Space Physics, 126(2), e2020JA028452, 2021. https://doi.org/10.1029/2020JA028452.
Forecasting SYM‐H Index: A Comparison Between Long Short‐Term Memory and Convolutional Neural Networks
Papers from SWICo members
F. Siciliano G. Consolini, R. Tozzi, M. Gentili, F. Giannattasio, and P. De Michelis.
Geomagnetic indices are proxies of the geomagnetic disturbances observed on the ground during geomagnetic storms and substorms. So, their forecasting represents a key point to develop warning systems for the mitigation of possible effects of severe geomagnetic storms on critical ground infrastructures. Here, we forecast SYM‐H index using two artificial neural network models based on two conceptually different networks: the Long Short‐Term Memory (LSTM) and the Convolutional Neural Network (CNN). Both networks are trained with two different sets of data: 1) interplanetary magnetic field (IMF) components and magnitude, and 2) interplanetary magnetic field components and magnitude and previous SYM‐H values. Specifically, we selected 42 geomagnetic storms among the most intense occurred between 1998 and 2018.
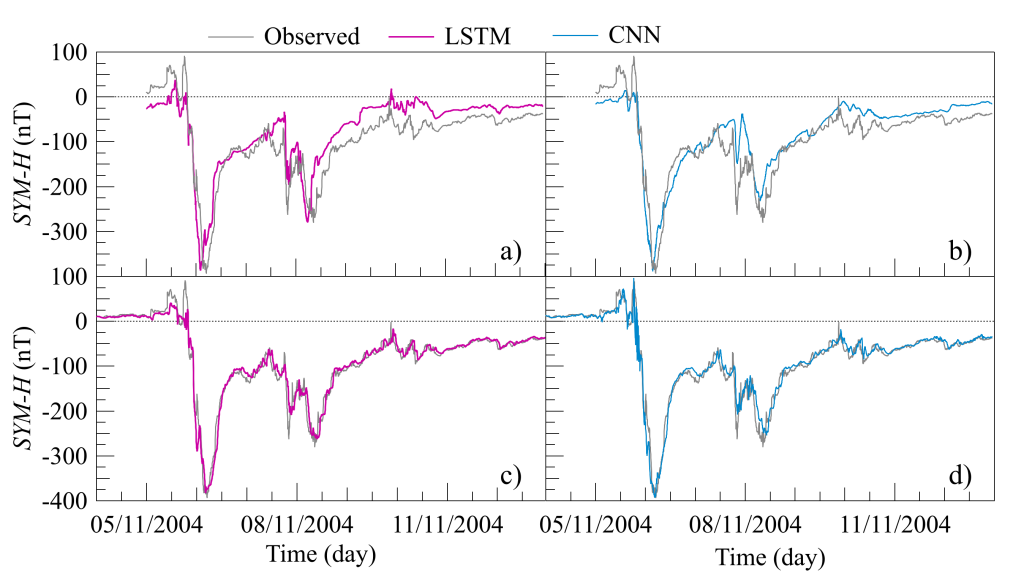
The performance of the two models has been compared thus pointing out the peculiarity of each model. In summary we have found that: 1) both networks are able to well forecast SYM‐H index 1 hour in advance, with values of the coefficient of determination R2 larger than 95%; 2) when using the data set that includes SYM-H index the model based on LSTM is slightly more accurate than that based on CNN; 3) differently, when using the data set consisting of IMF values only the model based on CNN displays a higher accuracy than that based on LSTM.
Publication: F. Siciliano G. Consolini R. Tozzi M. Gentili F. Giannattasio P. De Michelis, Forecasting SYM‐H Index: A Comparison Between Long Short‐Term Memory and Convolutional Neural Networks, Space Weather, 19 (2), 2021. https://doi.org/10.1029/2020SW002589
The Shipwreck of the Airship “Dirigibile Italia” in the 1928 Polar Venture: A Retrospective Analysis of the Ionospheric and Geomagnetic Conditions
Papers from SWICo members
B. Zolesi, M. Pezzopane, C. Bianchi, A. Meloni, Lj. R. Cander, and R. Tozzi.
On 25 May 1928, while coming back to the base in NyAlesund after having overflew the North Pole, the airship “Dirigibile Italia” shipwrecked on the ice‐pack in a region at about 400 km northeast of Svalbard Islands. Using a portable high frequency (HF) radio transmitter, survivors tried to send SOS messages and to establish a radio link with a ship closely anchored at King’s Bay, that is “Città di Milano” of the Italian Navy. All their attempts proved unsuccessful until a Russian radio amateur close to the town of Arkhangelsk about 1,900 km away succeeded in receiving the messages launched by the survivors and raised the alarm. This however happened only after 9 days of repeated radio‐distress transmissions.

This work provides a retrospective analysis of the ionospheric and geomagnetic conditions of those days to try to explain the HF radio communications problems experienced by the survivors. To this purpose, the International Reference Ionosphere model has been used, and early geomagnetic measurements have been analysed. We found that the HF transmission difficulties were associated with the “dead zone” of F‐region propagation but that they might have been exacerbated by solar and geomagnetically disturbed conditions of the days soon after the airship wreck.
Publication: B. Zolesi, M. Pezzopane, C. Bianchi, A. Meloni, Lj. R. Cander, and R. Tozzi, The Shipwreck of the Airship “Dirigibile Italia” in the 1928 Polar Venture: A Retrospective Analysis of the Ionospheric and Geomagnetic Conditions, Space Weather, 18, e2020SW002459, 2020. https://doi.org/10.1029/2020SW002459
The ESA Swarm mission to help ionospheric modeling: a new NeQuick topside formulation for mid-latitude regions
Papers from SWICo members
M. Pezzopane and A. Pignalberi.
The ionospheric topside representation made by the NeQuick model is improved by correcting the H0 parameter. This task is accomplished by fitting the NeQuick topside analytical function through the F2-layer absolute electron density maximum and the electron density value as measured by Swarm satellites from December 2013 to September 2018. The new NeQuick formulation is statistically validated by comparing modeled values to those derived from COSMIC/FORMOSAT-3 measured Radio Occultation profiles, and those measured by Swarm satellites.
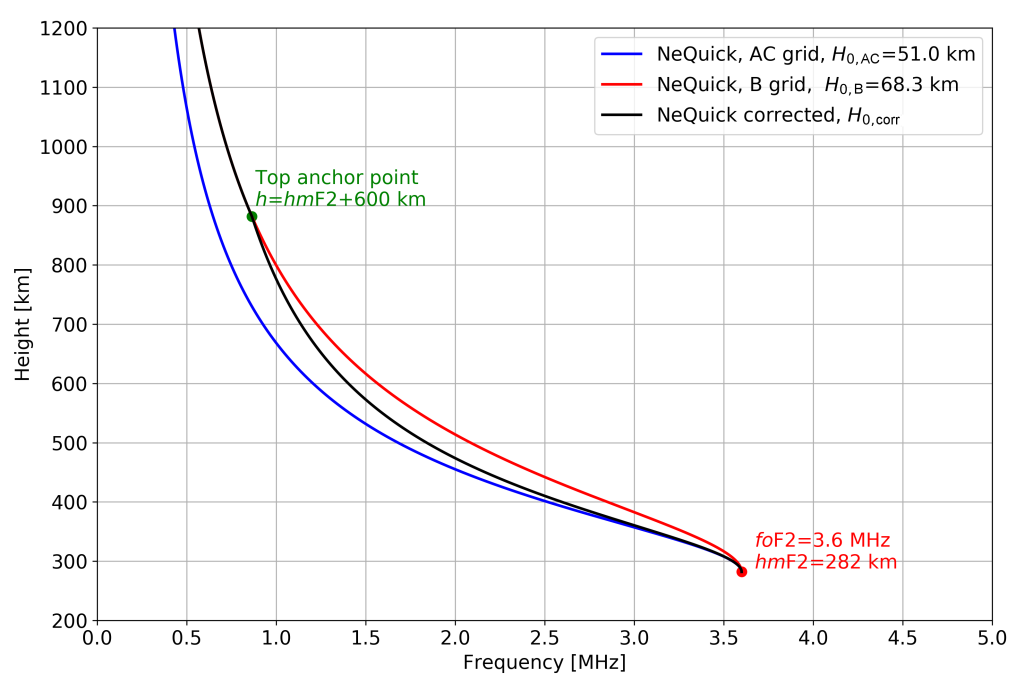
The results show that the proposed formulation is reliable and significantly improves the topside description made by the NeQuick model at mid latitudes, for both high and low solar activities. This means that this new formulation might be proposed as an additional topside option for the International Reference Ionosphere model.
Publication: M. Pezzopane and A. Pignalberi, The ESA Swarm mission to help ionospheric modeling: a new NeQuick topside formulation for mid-latitude regions, Scientific Reports, 9, 12253, 2019. https://doi.org/10.1038/s41598-019-48440-6
Maximum usable frequency and skip distance maps over Italy
Papers from SWICo members
M. Pietrella and M. Pezzopane.
This work describes how MUF and skip distance maps are generated combining the Simplified Ionospheric Regional Model (SIRM) and its UPdated version (SIRMUP) with the Lockwood algorithm. Climatological maps are generated every hour considering the predicted 12-months smoothed sunspots number. Nowcasting maps are instead generated every 15 min exploiting foF2 and M(3000)F2 data measured at the ionospheric stations of Rome and Gibilmanna.
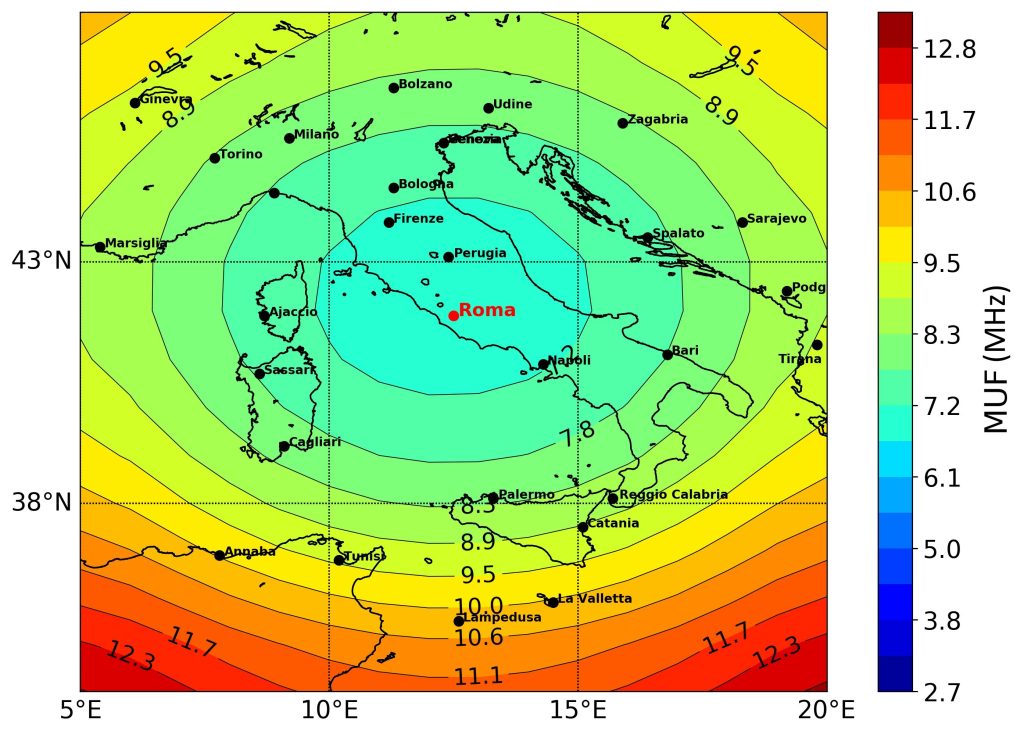
Nowcasting maps constitute the most important novelty because they let High Frequency (HF) users know in quasi real-time the radio propagation conditions over Italy. This is really important in terms of reliable radio links, especially in case of adverse space weather events.
Publication: M. Pietrella and M. Pezzopane, Maximum usable frequency and skip distance maps over Italy, Adv. Space Res., 66(2), 243, 2020. https://doi.org/10.1016/j.asr.2020.03.040
On the identification of coherent structures in space plasmas: the magnetic helicity-PVI method
Papers from SWICo members
F. Pecora, S. Servidio, A. Greco, W. H. Matthaeus
Plasma turbulence can be viewed as a magnetic landscape populated by large- and small-scale coherent structures. In this complex network, large helical magnetic tubes might be separated by small-scale magnetic reconnection events (current sheets). However, the identification of these magnetic structures in a continuous stream of data has always been a challenging task.
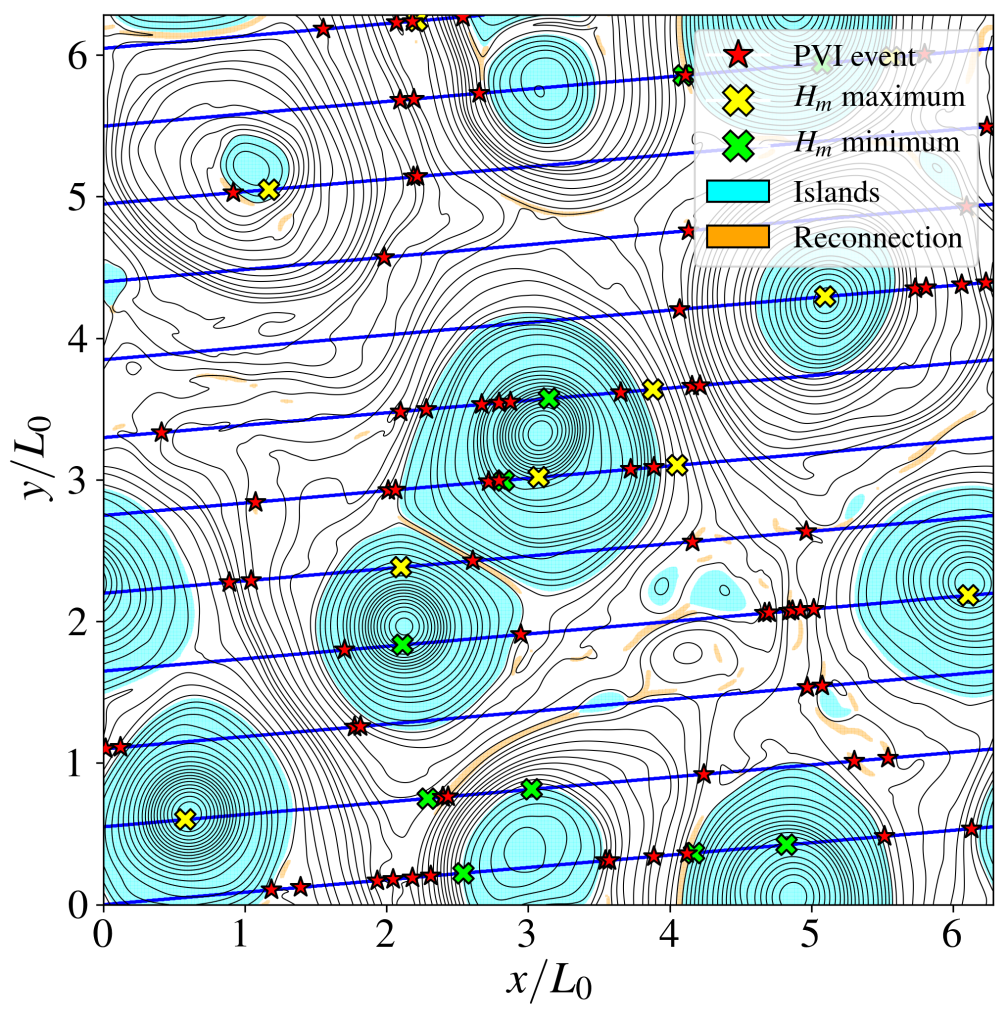
Here we present a method that is able to characterize both the large and small scale structures of the turbulent solar wind, based on the combined use of a filtered magnetic helicity (H_m) and the Partial Variance of Increments (PVI).
This simple, single-spacecraft technique, has been validated first via direct numerical simulations of plasma turbulence and then applied to data from the Parker Solar Probe (PSP) mission.
This novel analysis, combining H_m~PVI methods, reveals that a large number of flux tubes populate the solar wind and continuously merge in contact regions where magnetic reconnection and particle acceleration may occur.
Publication: Pecora F., Servidio S., Greco A., Matthaeus W.~H., 2021, A\&A, 650, A20. doi:10.1051/0004-6361/202039639. https://www.aanda.org/component/article?access=doi&doi=10.1051/0004-6361/202039639
Quando il Sole fa i capricci
E’ stato recentemente pubblicato un libro divulgativo dedicato allo Space Weather scritto dal Prof. Umberto Villante: Quando il Sole fa i capricci (ed. Dedalo).
Blackout, interruzioni nelle comunicazioni, traffico aereo in tilt, animali e navigatori che perdono la bussola, satelliti fuori uso, pericoli per gli astronauti: le tempeste solari sono sempre esistite, ma oggi il loro impatto sulla nostra società tecnologica può essere devastante. La giovane disciplina denominata space weather, meteorologia spaziale, studia proprio i capricci del Sole e i loro effetti sul nostro pianeta. Villante, tra i massimi esperti del settore, ci guida in modo chiaro e originale nella storia e negli attuali programmi di studio internazionali su queste tematiche, permettendoci di capire a che punto siamo nella comprensione e nella previsione di tali fenomeni. Tra aurore polari, tempeste magnetiche e possibili ripercussioni su milioni di persone, dobbiamo oggi chiederci che tempo farà sul Sole domani.
Magnetic Energy Balance in the Quiet Sun on Supergranular Spatial and Temporal Scales
Papers from SWICo members
F. Giannattasio, G. Consolini, F. Berrilli, and D. Del Moro
Small-scale magnetic fields are ubiquitous in the quiet solar photosphere and may store and transfer huge amounts of energy to the upper atmospheric layers giving rise to a chain of phenomena that are relevant for Space Weather. For this reason, it is fundamental to constrain the energetics of the quiet Sun.
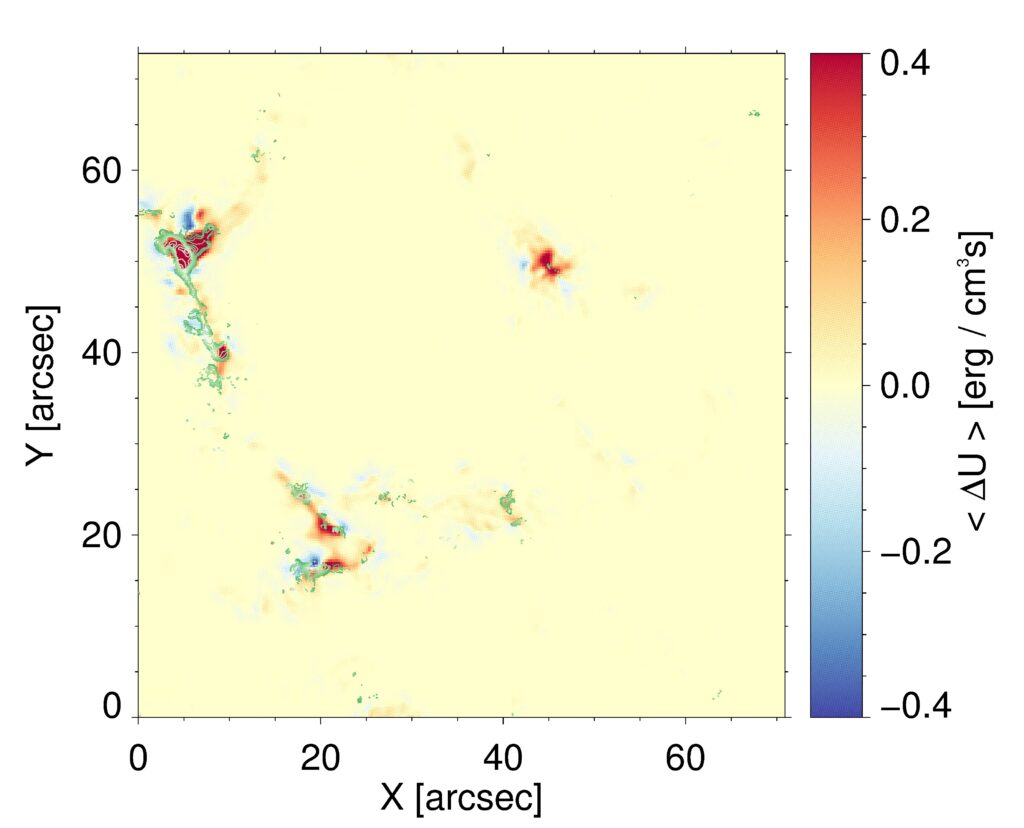
By taking advantage of a 24 hr long with 90 s cadence magnetogram time series acquired by the Hinode mission without interruption, we computed, for the first time, the average photospheric electric field, the average current density, and starting from these, the rate of change of magnetic energy density on supergranular spatial and temporal scales. The main result is that, on average, the energy provided by photospheric electric and magnetic fields and current density can sustain the magnetic fields in the network.
Publication: F. Giannattasio, G. Consolini, F. Berrilli, and D. Del Moro, Magnetic Energy Balance in the Quiet Sun on Supergranular Spatial and Temporal Scales, The Astrophysical Journal, 904, 1, 2020.
https://doi.org/10.3847/1538-4357/abbb36
Multiscale Analysis of the Turbulent Ionospheric Medium
Papers from SWICo members
P. De Michelis and R. Tozzi
The physical parameters which describe many fluid and plasma systems, such as density, velocity, temperature, and electric and magnetic fields, are often characterized by fluctuating values. When the fluctuations are observed over many spatial and temporal scales and a nonlinear transfer of energy occurs between the different scales, the system is generally said to be in a turbulent state. Several interplanetary space environments, such as solar wind, ion foreshock, the magnetosheath, and the magnetotail and, last but not least, the ionosphere, have been found to be in a turbulent state.
Turbulence crucially influences the cross-scale coupling of the dynamical processes: it can influence the transport of mass, momentum, and energy from solar wind and the magnetosphere to the ionosphere and can also perturb the equilibrium structure of the ionosphere, as well as the plasma dynamics and particle energization at many locations in the ionosphere. Here, we review some recent findings on the multiscale and turbulent character of the ionosphere, with a special emphasis on high-latitudes. In particular, we analyse some scaling features of magnetic field fluctuations, relating them to their spectral properties and the occurrence of intermittency phenomena.
Publication: P. De Michelis and R. Tozzi, “Multiscale Analysis of the Turbulent Ionospheric Medium”, Chapter 19 in “The Dynamical Ionosphere”, Editors: M. Materassi, B. Forte, A. Coster and S. Skone, Elsevier 2020.
https://doi.org/10.1016/B978-0-12-814782-5.00019-4