On the 2015 St. Patrick Storm Turbulent State of the Ionosphere: Hints from the Swarm Mission
Papers from SWICo members
P. De Michelis, A. Pignalberi, G. Consolini, I. Coco, R. Tozzi, M. Pezzopane, F. Giannattasio and G. Balasis
We analysed the electron density fluctuations in the high-latitude ionosphere during the St. Patrick’s geomagnetic storm occurred on 17 March 2015, in order to investigate the possible turbulent nature of the ionospheric plasma. Electron density measurements were taken in both hemispheres from two of the three ESA Swarm satellites (A and B), covering the time period between 16 and 22 March 2015.
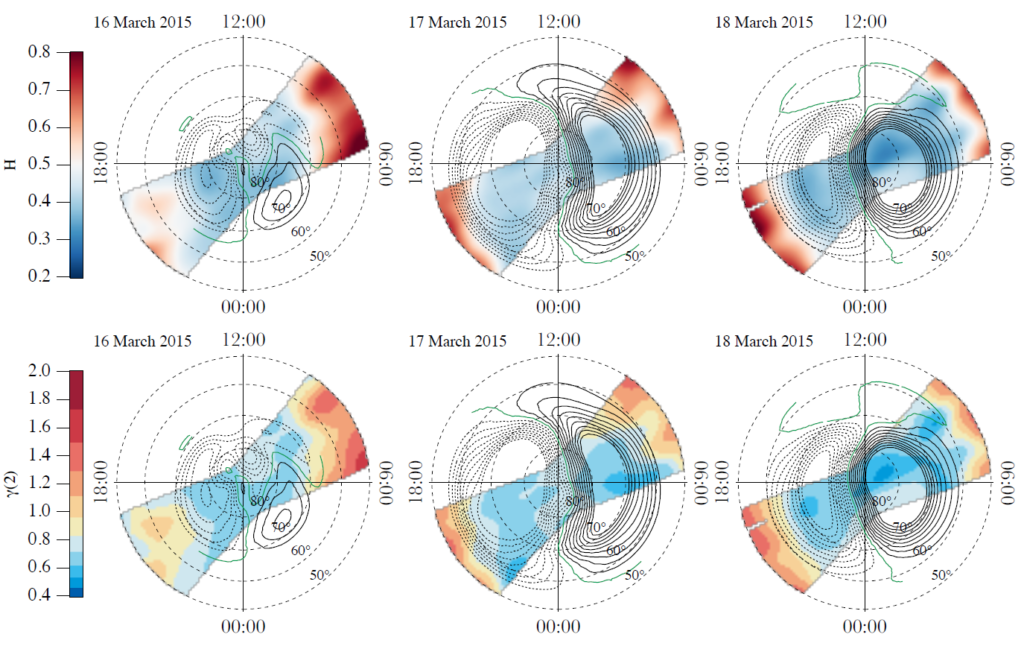
We reconstructed the Rate Of change of electron Density Index (RODI), which can be considered as a proxy for the presence of plasma irregularities, and compared it with quantities related to the spectral properties of the electron density fluctuations. We found that, independently of the different phases of the analyzed geomagnetic storm, the observed fluctuations pattern seems to support the idea of a fluid and/or magnetohydrodynamic turbulence as the main cause of the high values of RODI recorded at high latitudes in the auroral and polar cap regions.
Publication: P. De Michelis, A. Pignalberi, G. Consolini, I. Coco, R. Tozzi, M. Pezzopane, F. Giannattasio and G. Balasis, On the 2015 St. Patrick Storm Turbulent State of the Ionosphere: Hints from the Swarm Mission, J. Geophys. Res.: Space Physics, 125, 2020.
https://doi.org/10.1029/2020JA027934
Linear vs nonlinear methods for detecting magnetospheric and ionospheric current systems patterns
Papers from SWICo members
T. Alberti, F. Giannattasio, P. De Michelis and G. Consolini.
The geomagnetic field time series can be viewed as a superposition of signals which represent the different contributions to it at different scales coming from various sources both internal and external to the Earth. Here, we apply two different methods of analysis in order to recognize in the magnetic field of external origin the different contributions coming from external sources, making use of measurements of the vertical component of the geomagnetic field (directed away from the Earth’s center) recorded by the European Space Agency (ESA) Swarm A and B satellites at low and mid latitudes during a geomagnetically quiet period.
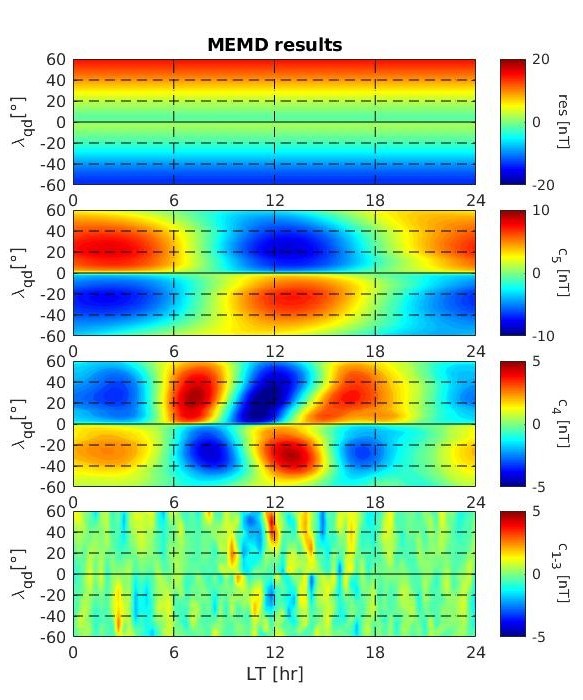
The first is a linear method, that is, the Empirical Orthogonal Functions (EOF); the second is a nonlinear one, i.e. the Multivariate Empirical Mode Decomposition (MEMD). As the external contributions to the magnetic signal are intrinsically nonlinear, the MEMD seems to give better results with respect to EOF, and only five modes and a residue are necessary to reproduce the different contributions coming from the external sources against the 26 modes that are necessary in the case of the EOF. This study is an example of the potential of the MEMD for the analysis of the geomagnetic field of external origin, and of its capability to separate the ionospheric from the magnetospheric contributions in a simple and rapid way.
Publication: T. Alberti, F. Giannattasio, P. De Michelis and G. Consolini, Linear vs nonlinear methods for detecting magnetospheric and ionospheric current systems patterns, Earth and Space Science, 2020.
https://doi.org/10.1029/2019EA000559
On the multifractal features of low-frequency magnetic field fluctuations in the field-aligned current ionospheric polar regions: Swarm observations
Papers from SWICo members
G. Consolini, P. De Michelis, T. Alberti, F. Giannattasio, I. Coco, R. Tozzi, and T. T. S. Chang
In this work we have characterized the magnetic field fluctuations in the high latitude ionosphere by means of high resolution magnetic measurements (50 Hz) from the European Space Agency Earth’s observation mission Swarm.
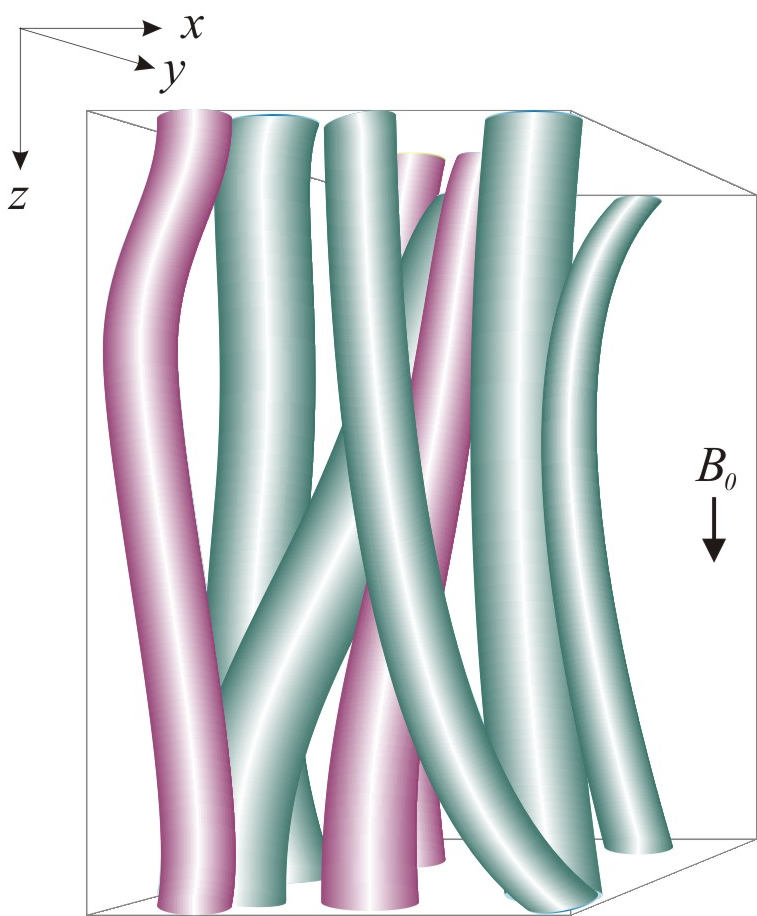
We found anomalous spatiotemporal scaling features of magnetic field fluctuations in regions where field‐aligned currents occur, at spatial scales in the range 0.8–80 km (timescales in the range 0.1–10 s). The nature of these fluctuations is multifractal, suggesting a highly complex structure of the field‐aligned currents. Our results support the hypothesis that field‐aligned currents are filamentary in nature, and this paves the way to new perspectives in the comprehension of the physical processes responsible for the magnetospheric‐ionospheric coupling.
Publication: G. Consolini, P. De Michelis, T. Alberti, F. Giannattasio, I. Coco, R. Tozzi, and T. T. S. Chang, On the multifractal features of low-frequency magnetic field fluctuations in the field-aligned current ionospheric polar regions: Swarm observations, J. Geophys. Res.: Space Physics, 125, 2020.
https://doi.org/10.1029/2019JA027429
Secondo Congresso della Space Weather Italian Community (SWICo)
Il “Secondo Congresso Nazionale SWICo” si terrà a Roma presso la sede dell’ASI nei giorni 9, 10 e 11 febbraio 2022 (https://swico2021.web.roma2.infn.it/). Il Congresso sarà momento di incontro e confronto dell’intera comunità eliogeofisica italiana impegnata nelle discipline relative allo Space Weather (dal Sole all’interno della Terra). E’ pertanto aperto anche a ricercatori e tecnologi non aderenti a SWICo ed è particolarmente incoraggiata la partecipazione attiva di studenti, dottorandi e giovani ricercatori.
Durante il convegno si terrà anche l’Assemblea Nazionale SWICo per il rinnovo degli Organi Statutari.
Il Congresso offrirà anche l’opportunità del conferimento del Premio “Franco Mariani” (https://swico2021.web.roma2.infn.it/premio-mariani), istituito per onorare la memoria di una personalità scientifica di statura internazionale e rivolto a giovani laureati magistrali in discipline inerenti lo “Space Weather”.
La scadenza per l’iscrizione, l’invio degli abstract e delle domande di partecipazione al premio è il 30 maggio 2021.
Premio Franco Mariani

Il Gruppo Nazionale SWICo intende rendere omaggio alla memoria del prof. Franco Mariani, personalità scientifica di rilievo in ambito internazionale, pioniere e protagonista dello sviluppo della ricerca spaziale in Italia, con l’istituzione del Premio “Franco Mariani” per giovani laureati magistrali in discipline inerenti lo “Space Weather” (https://swico2021.web.roma2.infn.it/premio-mariani/).
Il premio è rivolto a giovani laureati magistrali in discipline inerenti lo Space Weather.
Più precisamente, l’ammissione è riservata a laureati delle Università italiane che abbiano conseguito la Laurea Magistrale negli anni accademici 2017-18, 2018-19, 2019-20, e comunque entro la data di scadenza del bando, discutendo tesi su tematiche inerenti lo Space Weather.
La scadenza per l’invio delle domande di partecipazione al premio è il 15 maggio 2021.
Continuum Enhancements, Line Profiles, and Magnetic Field Evolution during Consecutive Flares
Papers from SWICo members
Zuccarello, Francesca; Guglielmino, Salvo L.; Capparelli, Vincenzo; Mathioudakis, Mihalis; Keys, Peter H.; Criscuoli, Serena; Falco, Mariachiara; Murabito, Mariarita
The occurrence of very energetic solar flares can give rise to Space Weather phenomena impacting on the circum-terrestrial environment.It is well known that, during solar flares, magnetic energy can be converted into electromagnetic radiation from radio waves to γ-rays. Enhancements in the continuum at visible wavelengths, as well as continuum enhancements in the FUV and NUV passbands, give rise to the so-called white-light (WL) flares. Moreover, the strong energy release taking place during these events can lead to the rearrangement of the magnetic field at the photospheric level, causing morphological changes in sunspots.
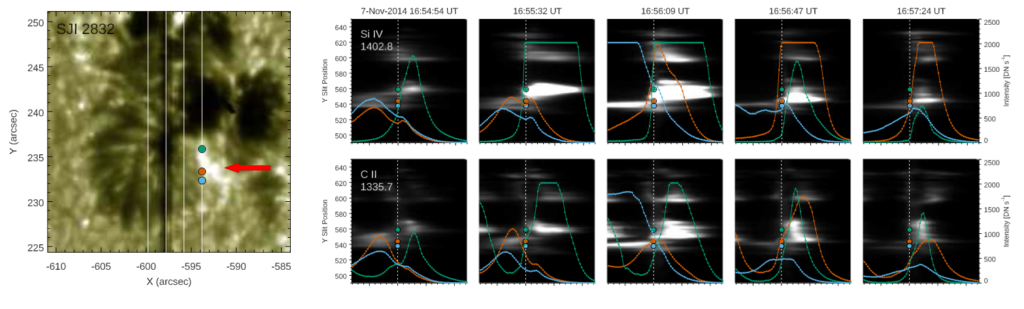
In this paper, we describe the results of the analysis performed using data acquired by satellite instruments (Interface Region Imaging Spectrograph (IRIS), Solar Dynamics Observatory/Helioseismic and Magnetic Imager, Hinode/Solar Optical Telescope) and ground-based telescopes (Rapid Oscillations in the Solar Atmosphere (ROSA)/Dunn Solar Telescope) during two consecutive C7.0 and X1.6 flares (accompanied by an eruption) that occurred in active region NOAA 12205 on 2014 November 7. The analysis shows the presence of continuum enhancements during the evolution of the events, observed both in ROSA images and in IRIS spectra. We also investigate the role played by the evolution of the δ sunspots in the flare triggering, as well as the changes in the penumbrae surrounding these sunspots as a further consequence of these flares.
Publication: Zuccarello F., Guglielmino S. L., Capparelli V., Mathioudakis M., Keys P. H., Criscuoli S., Falco M., et al., 2020, ApJ, 889, 65. doi:10.3847/1538-4357/ab621f
https://iopscience.iop.org/article/10.3847/1538-4357/ab621f/pdf
The ionosphere prediction service prototype for GNSS users
Papers from SWICo members
Sreeja Vadakke Veettil, Claudio Cesaroni, Marcio Aquino, Giorgiana De Franceschi, Francesco Berrili, Filippo Rodriguez, Luca Spogli, Dario Del Moro, Alice Cristaldi, Vincenzo Romano, Roberto Ronchini, Stefano Di Rollo, Eric Guyader, Angela Aragon-Angel
The effect of the Earth’s ionosphere represents the single largest contribution to the Global Navigation Satellite System (GNSS) error budget and harsh ionospheric conditions can impact seriously on GNSS system functionality, including integrity, accuracy and availability. With the growing reliance on GNSS for many modern technological applications, reliable ionospheric forecasts can contribute to the understanding and mitigation of the impact of the ionosphere on our technology based society.
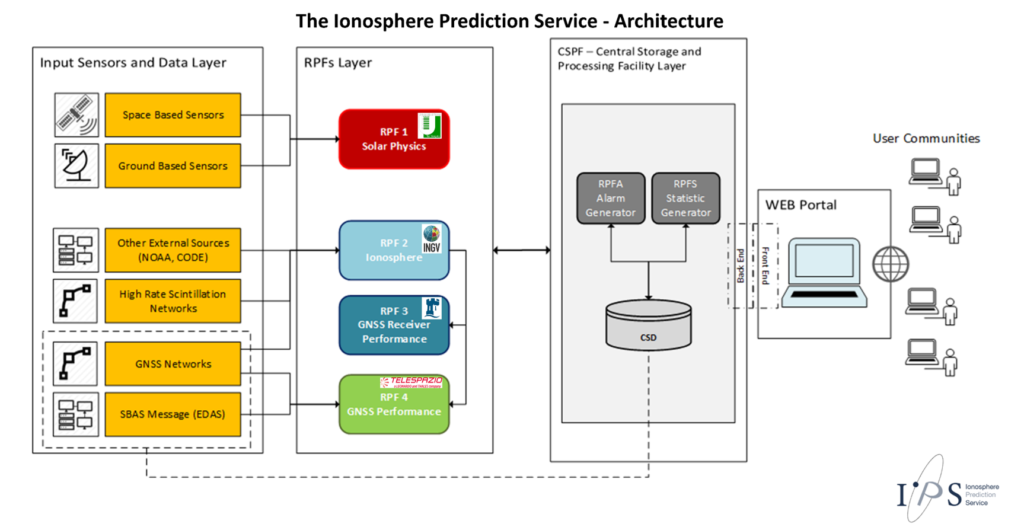
With this aim, the Ionosphere Prediction Service (IPS) project was set up to design and develop a prototype platform to translate the forecast of the ionospheric conditions into a service customized for different GNSS user communities. To achieve this overarching aim, four different product groups dealing with solar activity, ionospheric activity, GNSS receiver performance and service performance have been developed and integrated into a service chain, which is made available through an innovative and fully customizable web based platform. This paper provides an overview of the IPS project describing its overall architecture, products and platform.
Publication: Veettil, S. V., Cesaroni, C., Aquino, M., De Franceschi, G., Berrili, F., Rodriguez, F., … & Ronchini, R. (2019). The ionosphere prediction service prototype for GNSS users. Journal of Space Weather and Space Climate, 9, A41.
https://www.swsc-journal.org/articles/swsc/full_html/2019/01/swsc190019/swsc190019.html
Neural network based model for global Total Electron Content forecasting
Papers from SWICo members
Claudio Cesaroni, Luca Spogli, Angela Aragon-Angel, Michele Fiocca, Varuliator Dear, Giorgiana De Franceschi, Vincenzo Romano
We describe a novel empirical model to forecast, one day in advance, the Total Electron Content (TEC) at global scale. The technique is based on the Global Ionospheric Map (GIM), provided by the International GNSS Service (IGS), and exploits a nonlinear autoregressive neural network with external input (NARX) applied to selected TEC time series for soma particular GIM grid points (24 h single-point TEC forecasting), taking into account the actual and forecasted geomagnetic conditions. To extend the forecasting at a global scale, the technique leverages of the NeQuick2 Model fed by an effective sunspot number R12 (R12eff), calculated by minimizing the root mean square error (RMSE) between NARX output and NeQuick2 applied at the same GIM grid points. This new approach is able to reproduce the behavior of the ionosphere especially during disturbed periods.
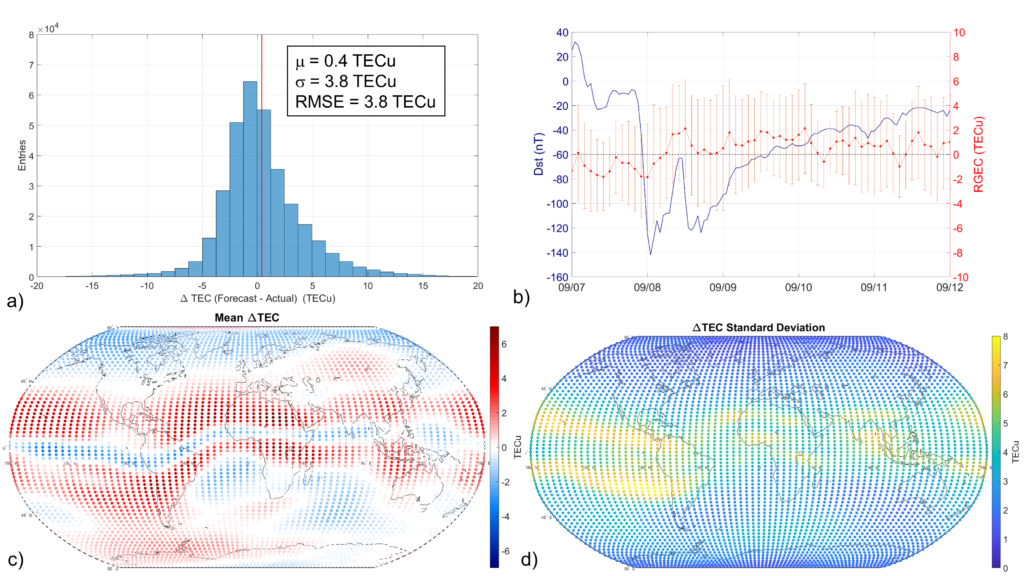
The performance of the forecasting model is extensively validated under different geospatial conditions, against both TEC maps products by UPC (Universitat Politècnica de Catalunya) and independent TEC data from Jason-3 spacecraft. The validation gives very satisfactory results in terms of RMSE, as it has been found to range between 3 and 5 TECu. RMSE depend on the latitude sectors, time of the day, geomagnetic conditions, and provide a statistical estimation of the accuracy of the 24-h forecasting technique even over the areas poorly covered by GNSS receivers (i.e. the oceans). The validation of the forecasting during five geomagnetic storms reveals that the model performance is not deteriorated during disturbed periods. This 24-h empirical approach is currently implemented on the Ionosphere Prediction Service (IPS), a prototype platform to support different classes of GNSS users in order to support the mitigation of the ionospheric effects on GNSS based technologies.
Publication: Cesaroni, C., Spogli, L., Aragon-Angel, A., Fiocca, M., Dear, V., De Franceschi, G., & Romano, V. (2020). Neural network based model for global Total Electron Content forecasting. Journal of Space Weather and Space Climate, 10, 11.
https://www.swsc-journal.org/articles/swsc/abs/2020/01/swsc190061/swsc190061.html
On the Analytical Description of the Topside Ionosphere by NeQuick: Modeling the Scale Height through COSMIC/FORMOSAT-3 Selected Data
Papers from SWICo members
Alessio Pignalberi, Michael Pezzopane, David R. Themens, Haris Haralambous, Bruno Nava, Pierdavide Coïsson
The topside part of the ionosphere extends from the F2-layer peak, corresponding to the ionospheric electron density maximum, to the plasmasphere. Developing a reliable model of the topside ionosphere is one of the most difficult tasks because instruments commonly used to probe the ionosphere, namely ionosondes, are only capable of sounding the region below the F2-layer peak. The topside ionosphere is characterized by a monotonic decrease of the electron density as the ion population smoothly transitions from the heavy O+ ions to the lighter H+ and He+ ions. This behavior is described by means of monotonically decreasing analytical functions dependent on a parameter called topside scale height whose exact description is the most challenging task for the topside ionosphere modeling.
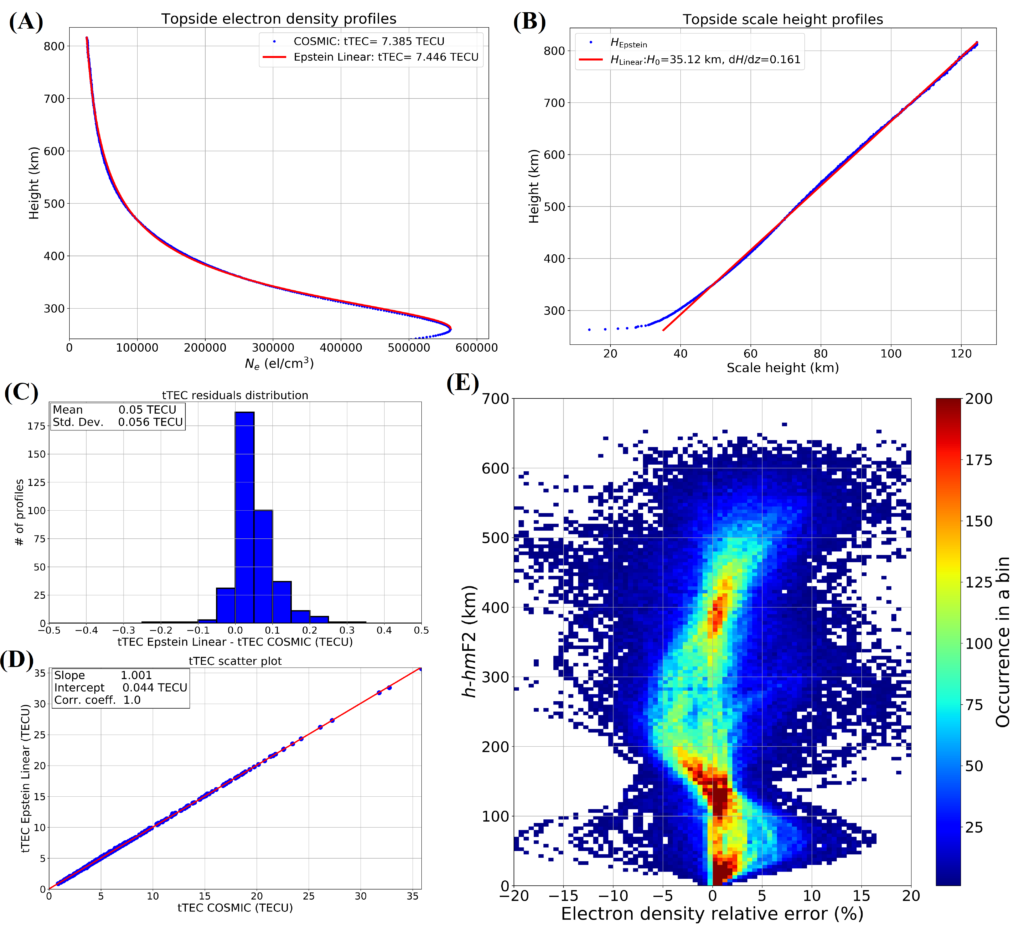
In this paper, the analytical description of the topside ionosphere included in the NeQuick model is deeply analyzed. The NeQuick modeled scale height behavior is first studied at infinity and then for the lowest part of the topside region through an expansion in Taylor series near the F2-layer peak. The significant influence of the NeQuick topside parameters in the modeling of the topside profile is investigated in detail and, in particular, it is shown that for the lowest part of the topside the model assumes a linearly increasing trend of the topside scale height. Afterwards, the NeQuick topside formulation is inverted to derive a fully analytical expression of the topside scale height as a function of the electron density and F2-layer peak parameters. This expression has been applied to a selected and very reliable dataset of COSMIC/FORMOSAT-3 Radio Occultation profiles. The performed statistical analyses strongly support the supposed linear trend of the topside scale height for the lowest part of the topside ionosphere, as embedded in NeQuick; thus, the developed technique might be relevant for Space weather modeling purposes.
Publication: A. Pignalberi, M. Pezzopane, D. R. Themens, H. Haralambous, B. Nava and P. Coïsson, “On the Analytical Description of the Topside Ionosphere by NeQuick: Modeling the Scale Height Through COSMIC/FORMOSAT-3 Selected Data,” in IEEE Journal of Selected Topics in Applied Earth Observations and Remote Sensing, vol. 13, pp. 1867-1878, 2020, doi: 10.1109/JSTARS.2020.2986683.
https://ieeexplore.ieee.org/document/9072529
The ionospheric irregularities climatology over Svalbard from solar cycle 23
Papers from SWICo members
Giorgiana De Franceschi, Luca Spogli, Lucilla Alfonsi, Vincenzo Romano, Claudio Cesaroni, Ingrid Hunstad
An unprecedented climatology of the ionospheric irregularities over the Svalbard (NO) derived from the longest Global Navigation Satellite Systems (GNSS) scintillation data series ever collected. Two receivers for scintillation monitoring are working at Ny-Ålesund, the first of which has been installed in late September 2003.
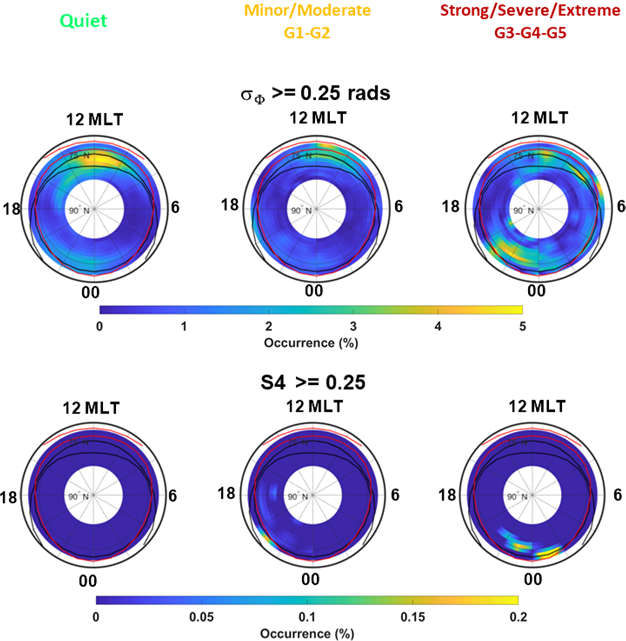
They are able to investigate auroral and cusp/cap regions and the length of the data series allows describing the Arctic ionosphere along about two solar cycles, from the descending phase of cycle 23 to almost the end of cycle 24. A detailed assessment of the long-term behaviour of the ionosphere under solar maximum and solar minimum conditions is provided including several periods of perturbed ionospheric weather caused by unfavourable heliogeophysical conditions. Since November 2015, a multi-constellation GNSS receiver has been deployed in Ny-Ålesund, providing the opportunity to perform the ionospheric climatology from Galileo signals. The results offer realistic features of the high latitude ionosphere, providing a broad spectrum of ionospheric reactions to different space weather conditions.
Publication: De Franceschi, G., Spogli, L., Alfonsi, L., Romano, V., Cesaroni, C., & Hunstad, I. (2019). The ionospheric irregularities climatology over Svalbard from solar cycle 23. Scientific reports, 9(1), 1-14.
https://www.nature.com/articles/s41598-019-44829-5