Home » 2020
Yearly Archives: 2020
Continuum Enhancements, Line Profiles, and Magnetic Field Evolution during Consecutive Flares
Papers from SWICo members
Zuccarello, Francesca; Guglielmino, Salvo L.; Capparelli, Vincenzo; Mathioudakis, Mihalis; Keys, Peter H.; Criscuoli, Serena; Falco, Mariachiara; Murabito, Mariarita
The occurrence of very energetic solar flares can give rise to Space Weather phenomena impacting on the circum-terrestrial environment.It is well known that, during solar flares, magnetic energy can be converted into electromagnetic radiation from radio waves to γ-rays. Enhancements in the continuum at visible wavelengths, as well as continuum enhancements in the FUV and NUV passbands, give rise to the so-called white-light (WL) flares. Moreover, the strong energy release taking place during these events can lead to the rearrangement of the magnetic field at the photospheric level, causing morphological changes in sunspots.
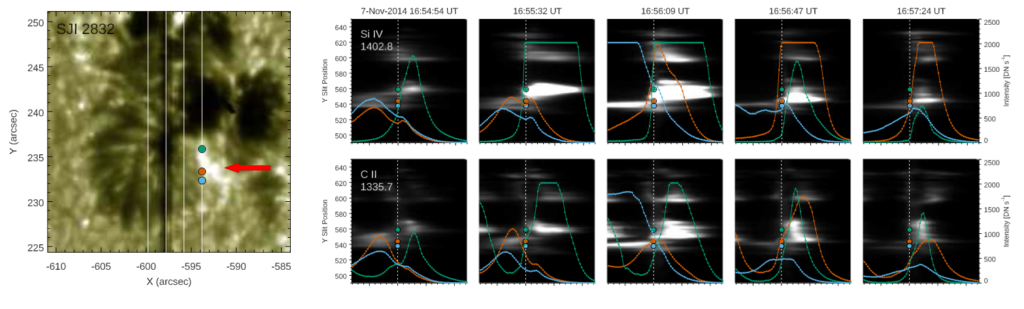
In this paper, we describe the results of the analysis performed using data acquired by satellite instruments (Interface Region Imaging Spectrograph (IRIS), Solar Dynamics Observatory/Helioseismic and Magnetic Imager, Hinode/Solar Optical Telescope) and ground-based telescopes (Rapid Oscillations in the Solar Atmosphere (ROSA)/Dunn Solar Telescope) during two consecutive C7.0 and X1.6 flares (accompanied by an eruption) that occurred in active region NOAA 12205 on 2014 November 7. The analysis shows the presence of continuum enhancements during the evolution of the events, observed both in ROSA images and in IRIS spectra. We also investigate the role played by the evolution of the δ sunspots in the flare triggering, as well as the changes in the penumbrae surrounding these sunspots as a further consequence of these flares.
Publication: Zuccarello F., Guglielmino S. L., Capparelli V., Mathioudakis M., Keys P. H., Criscuoli S., Falco M., et al., 2020, ApJ, 889, 65. doi:10.3847/1538-4357/ab621f
https://iopscience.iop.org/article/10.3847/1538-4357/ab621f/pdf
The ionosphere prediction service prototype for GNSS users
Papers from SWICo members
Sreeja Vadakke Veettil, Claudio Cesaroni, Marcio Aquino, Giorgiana De Franceschi, Francesco Berrili, Filippo Rodriguez, Luca Spogli, Dario Del Moro, Alice Cristaldi, Vincenzo Romano, Roberto Ronchini, Stefano Di Rollo, Eric Guyader, Angela Aragon-Angel
The effect of the Earth’s ionosphere represents the single largest contribution to the Global Navigation Satellite System (GNSS) error budget and harsh ionospheric conditions can impact seriously on GNSS system functionality, including integrity, accuracy and availability. With the growing reliance on GNSS for many modern technological applications, reliable ionospheric forecasts can contribute to the understanding and mitigation of the impact of the ionosphere on our technology based society.
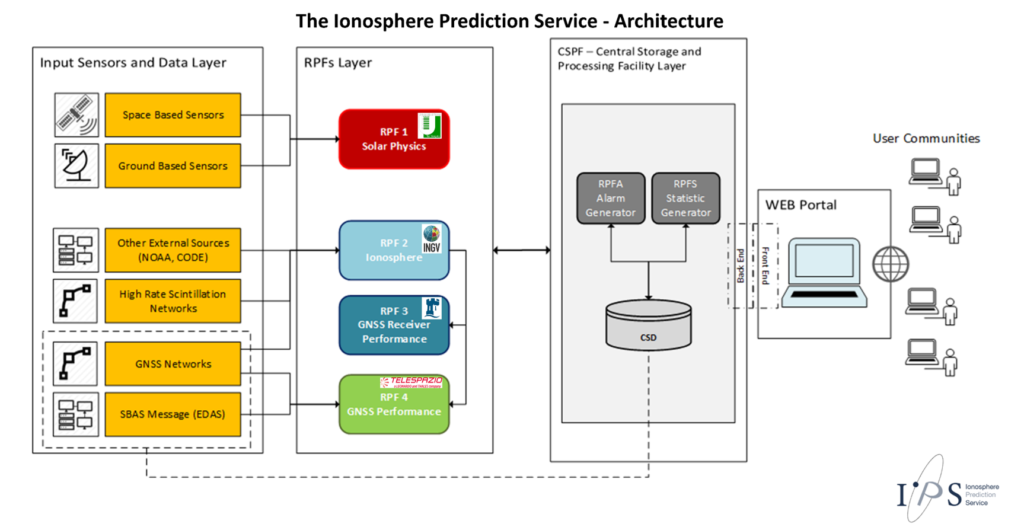
With this aim, the Ionosphere Prediction Service (IPS) project was set up to design and develop a prototype platform to translate the forecast of the ionospheric conditions into a service customized for different GNSS user communities. To achieve this overarching aim, four different product groups dealing with solar activity, ionospheric activity, GNSS receiver performance and service performance have been developed and integrated into a service chain, which is made available through an innovative and fully customizable web based platform. This paper provides an overview of the IPS project describing its overall architecture, products and platform.
Publication: Veettil, S. V., Cesaroni, C., Aquino, M., De Franceschi, G., Berrili, F., Rodriguez, F., … & Ronchini, R. (2019). The ionosphere prediction service prototype for GNSS users. Journal of Space Weather and Space Climate, 9, A41.
https://www.swsc-journal.org/articles/swsc/full_html/2019/01/swsc190019/swsc190019.html
Neural network based model for global Total Electron Content forecasting
Papers from SWICo members
Claudio Cesaroni, Luca Spogli, Angela Aragon-Angel, Michele Fiocca, Varuliator Dear, Giorgiana De Franceschi, Vincenzo Romano
We describe a novel empirical model to forecast, one day in advance, the Total Electron Content (TEC) at global scale. The technique is based on the Global Ionospheric Map (GIM), provided by the International GNSS Service (IGS), and exploits a nonlinear autoregressive neural network with external input (NARX) applied to selected TEC time series for soma particular GIM grid points (24 h single-point TEC forecasting), taking into account the actual and forecasted geomagnetic conditions. To extend the forecasting at a global scale, the technique leverages of the NeQuick2 Model fed by an effective sunspot number R12 (R12eff), calculated by minimizing the root mean square error (RMSE) between NARX output and NeQuick2 applied at the same GIM grid points. This new approach is able to reproduce the behavior of the ionosphere especially during disturbed periods.
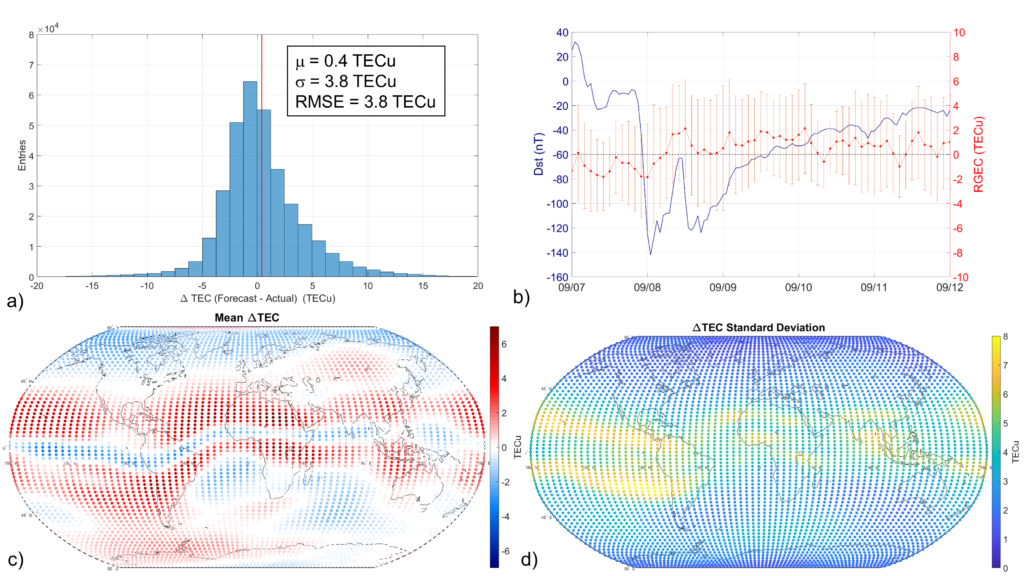
The performance of the forecasting model is extensively validated under different geospatial conditions, against both TEC maps products by UPC (Universitat Politècnica de Catalunya) and independent TEC data from Jason-3 spacecraft. The validation gives very satisfactory results in terms of RMSE, as it has been found to range between 3 and 5 TECu. RMSE depend on the latitude sectors, time of the day, geomagnetic conditions, and provide a statistical estimation of the accuracy of the 24-h forecasting technique even over the areas poorly covered by GNSS receivers (i.e. the oceans). The validation of the forecasting during five geomagnetic storms reveals that the model performance is not deteriorated during disturbed periods. This 24-h empirical approach is currently implemented on the Ionosphere Prediction Service (IPS), a prototype platform to support different classes of GNSS users in order to support the mitigation of the ionospheric effects on GNSS based technologies.
Publication: Cesaroni, C., Spogli, L., Aragon-Angel, A., Fiocca, M., Dear, V., De Franceschi, G., & Romano, V. (2020). Neural network based model for global Total Electron Content forecasting. Journal of Space Weather and Space Climate, 10, 11.
https://www.swsc-journal.org/articles/swsc/abs/2020/01/swsc190061/swsc190061.html
On the Analytical Description of the Topside Ionosphere by NeQuick: Modeling the Scale Height through COSMIC/FORMOSAT-3 Selected Data
Papers from SWICo members
Alessio Pignalberi, Michael Pezzopane, David R. Themens, Haris Haralambous, Bruno Nava, Pierdavide Coïsson
The topside part of the ionosphere extends from the F2-layer peak, corresponding to the ionospheric electron density maximum, to the plasmasphere. Developing a reliable model of the topside ionosphere is one of the most difficult tasks because instruments commonly used to probe the ionosphere, namely ionosondes, are only capable of sounding the region below the F2-layer peak. The topside ionosphere is characterized by a monotonic decrease of the electron density as the ion population smoothly transitions from the heavy O+ ions to the lighter H+ and He+ ions. This behavior is described by means of monotonically decreasing analytical functions dependent on a parameter called topside scale height whose exact description is the most challenging task for the topside ionosphere modeling.
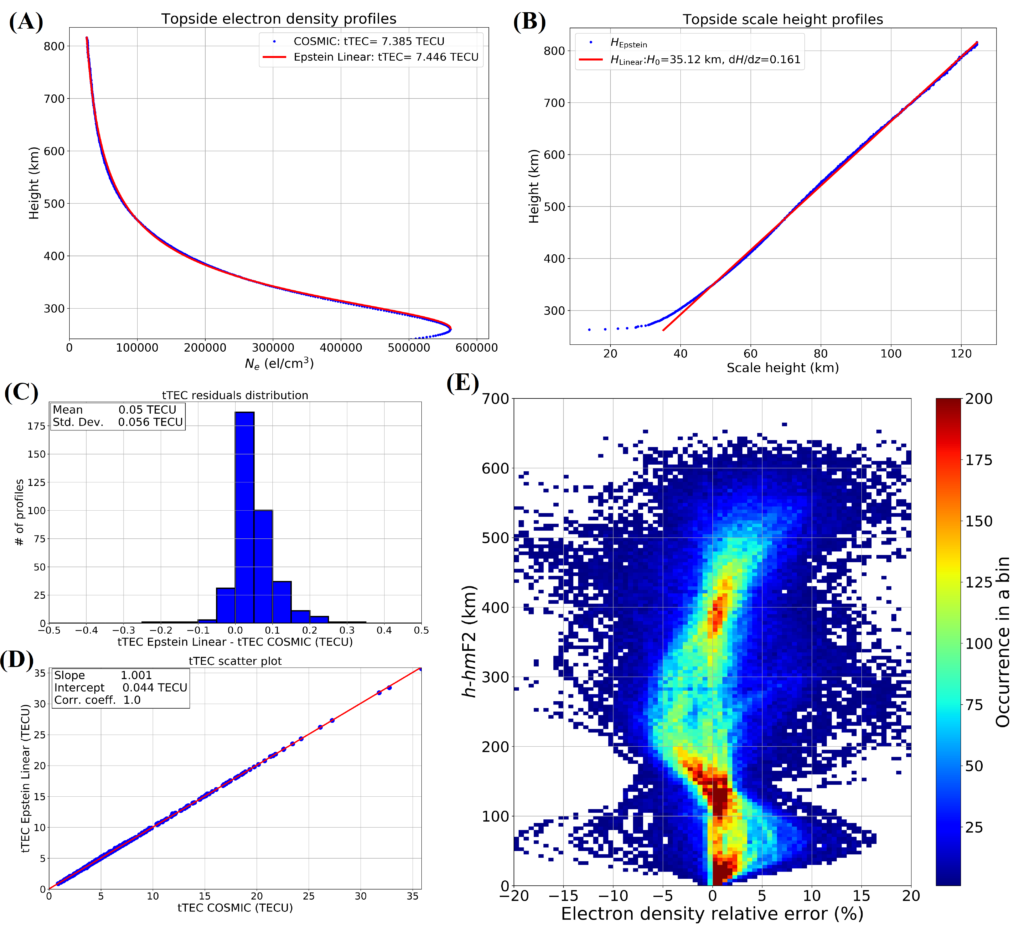
In this paper, the analytical description of the topside ionosphere included in the NeQuick model is deeply analyzed. The NeQuick modeled scale height behavior is first studied at infinity and then for the lowest part of the topside region through an expansion in Taylor series near the F2-layer peak. The significant influence of the NeQuick topside parameters in the modeling of the topside profile is investigated in detail and, in particular, it is shown that for the lowest part of the topside the model assumes a linearly increasing trend of the topside scale height. Afterwards, the NeQuick topside formulation is inverted to derive a fully analytical expression of the topside scale height as a function of the electron density and F2-layer peak parameters. This expression has been applied to a selected and very reliable dataset of COSMIC/FORMOSAT-3 Radio Occultation profiles. The performed statistical analyses strongly support the supposed linear trend of the topside scale height for the lowest part of the topside ionosphere, as embedded in NeQuick; thus, the developed technique might be relevant for Space weather modeling purposes.
Publication: A. Pignalberi, M. Pezzopane, D. R. Themens, H. Haralambous, B. Nava and P. Coïsson, “On the Analytical Description of the Topside Ionosphere by NeQuick: Modeling the Scale Height Through COSMIC/FORMOSAT-3 Selected Data,” in IEEE Journal of Selected Topics in Applied Earth Observations and Remote Sensing, vol. 13, pp. 1867-1878, 2020, doi: 10.1109/JSTARS.2020.2986683.
https://ieeexplore.ieee.org/document/9072529
The ionospheric irregularities climatology over Svalbard from solar cycle 23
Papers from SWICo members
Giorgiana De Franceschi, Luca Spogli, Lucilla Alfonsi, Vincenzo Romano, Claudio Cesaroni, Ingrid Hunstad
An unprecedented climatology of the ionospheric irregularities over the Svalbard (NO) derived from the longest Global Navigation Satellite Systems (GNSS) scintillation data series ever collected. Two receivers for scintillation monitoring are working at Ny-Ålesund, the first of which has been installed in late September 2003.
They are able to investigate auroral and cusp/cap regions and the length of the data series allows describing the Arctic ionosphere along about two solar cycles, from the descending phase of cycle 23 to almost the end of cycle 24. A detailed assessment of the long-term behaviour of the ionosphere under solar maximum and solar minimum conditions is provided including several periods of perturbed ionospheric weather caused by unfavourable heliogeophysical conditions. Since November 2015, a multi-constellation GNSS receiver has been deployed in Ny-Ålesund, providing the opportunity to perform the ionospheric climatology from Galileo signals. The results offer realistic features of the high latitude ionosphere, providing a broad spectrum of ionospheric reactions to different space weather conditions.
Publication: De Franceschi, G., Spogli, L., Alfonsi, L., Romano, V., Cesaroni, C., & Hunstad, I. (2019). The ionospheric irregularities climatology over Svalbard from solar cycle 23. Scientific reports, 9(1), 1-14.
https://www.nature.com/articles/s41598-019-44829-5
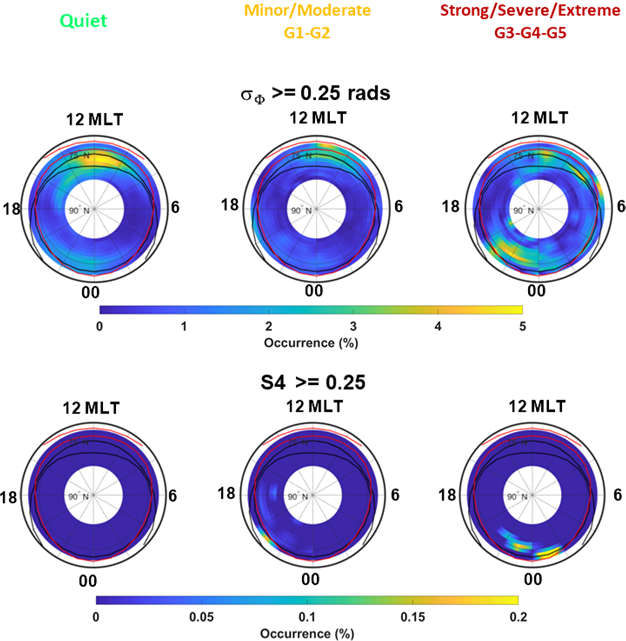
Role of the external drivers in the occurrence of low-latitude ionospheric scintillation revealed by multi-scale analysis
Papers from SWICo members
Luca Spogli, Mirko Piersanti, Claudio Cesaroni, Massimo Materassi, Antonio Cicone, Lucilla Alfonsi, Vincenzo Romano, and Rodolfo Gerardo Ezquer
By leveraging on the modal analysis provided by the Adaptive Local Iterative Filtering (ALIF) technique, this study focuses on the multi-scale variability of the amplitude scintillation on Global Navigation Satellite Systems (GNSSs) recorded over San Miguel de Tucumán (Argentina).
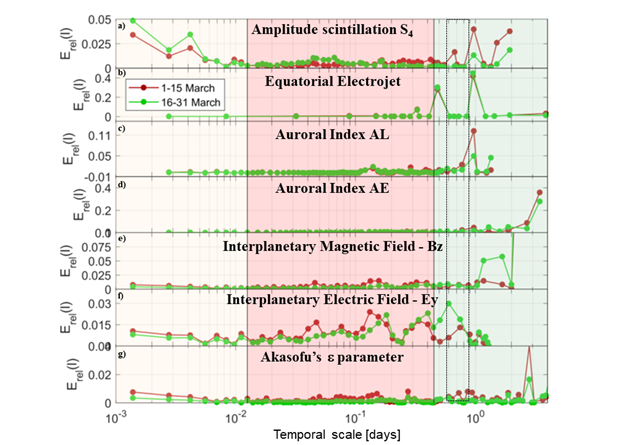
The site is nominally located below the expected position of the southern crest of the Equatorial Ionospheric Anomaly (EIA). The considered period is 1–31 March 2011, during which one minor and one moderate storm characterize the first half of the month, while generally quiet conditions of the geospace stand for the second half. The multiscale analysis is extended to helio-geophysical parameters to speculate on the possible relationship between forcing factors from the geospace and the ionospheric response. Resonant modes in the Akasofu (e) parameter are identified as likely related to the frequency components in the time evolution found for the amplitude scintillation index, hence modulating the scintillation itself. The analysis shows how the time-frequency structure of the amplitude scintillation can be characterized in terms of the resonant modes found in the combination of the Akasofu parameter. When assessed statistically, the proposed study can support models driven by interplanetary parameters aimed at characterizing the low latitude scintillation. The detection of resonant modes in the identified parameters can be used to define the Space Weather impact on GNSS signals recorded at ground.
Publication: Spogli, L., Piersanti, M., Cesaroni, C., Materassi, M., Cicone, A., Alfonsi, L., … & Ezquer, R. G. (2019). Role of the external drivers in the occurrence of low-latitude ionospheric scintillation revealed by multi-scale analysis. Journal of Space Weather and Space Climate, 9, A35
https://www.swsc-journal.org/articles/swsc/abs/2019/01/swsc180047/swsc180047.html
VINCENZO FERRARO AWARD 2021 for young scholars in Space Physics

The Vincenzo Ferraro Association intends to pay tribute to Prof. Vincenzo C.A. Ferraro, originally from Sorrento peninsula (Campania, Italy), an astrophysicist and pioneer in plasma physics, in order to encourage studies in the field of space physics.
With this in view, the Vincenzo Ferraro Association, represented by President Maddalena Ferraro, establishes for the year 2021 a “Vincenzo Ferraro” Prize to be assigned, after evaluation by a qualified scientific panel, to a young scholar in the physics of space plasmas with particular reference to his/her doctoral thesis.
Admission to this prize is reserved to students of Italian and foreign universities who have obtained a PhD degree in Physics or equivalent in Italy or abroad after September 1, 2016 with a thesis on topics relevant to the study of space plasmas.
All the details can be found in the attached official announcement.
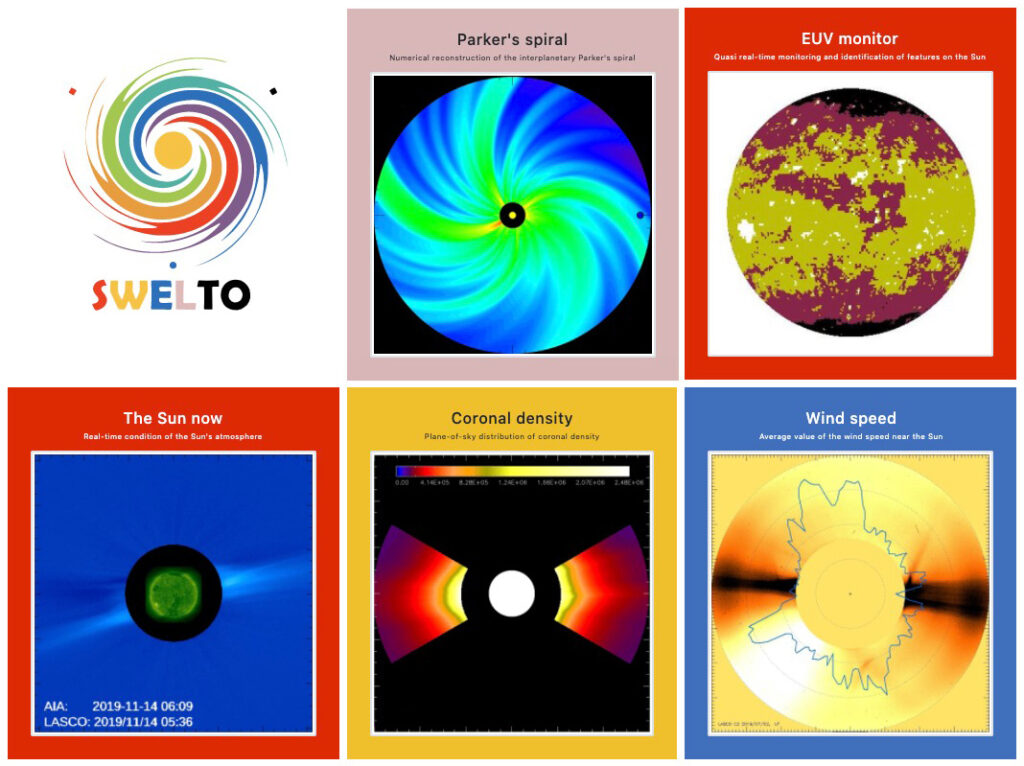
The SWELTO portal for Space Weather is now operating in real time
The portal of the SWELTO project is now operating and distributing in real-time the first “products” for future Space Weather applications. SWELTO (Space Weather Lab in Turin Observatory) aims to develop and test new diagnostic tools for analyzing space-based data providing real-time information on current conditions on the Sun and in the interplanetary space (https://www.oato.inaf.it/portfolio-items/swelto/).
During the project, new sensors will also be installed at Turin Observatory for the detection of ionospheric disturbances (with a SID monitor) and geomagnetic field disturbances (with a fluxgate magnetometer), now under calibration. Finally, through SWELTO other projects will be involved (such as PRISMA, SAMADHA, or others) that can provide through their sensors other context information related to space weather events.
Now, after more than two years of development, the SWELTO portal (http://swelto.oato.inaf.it/) is able to provide the following products in real time:
- “SunNow”: series of movies showing the evolution of the solar corona (inner corona in the EUV, and intermediate corona in VL) as observed from space along the Sun-Earth line over the last 3 days, up to the latest data currently available from the SOHO and SDO missions;
- “CorDens”: current distribution of the electron density in the intermediate corona as determined from coronographic images of the SOHO/LASCO instrument;
- “WindSpeed”: current distribution of the solar wind expansion velocity measured by the coronographic image sequences acquired by the SOHO/LASCO instrument (still under test);
- “ParkerSpiral”: current distributions of density and outflow speed of interplanetary plasma from 0.1 to 1.1 AU on the ecliptic plane as determined by a MHD numerical simulation constrained to the in situ measurements from ACE;
- “InSitu”: evolution during the last solar rotation (about 27 days) of the conditions of the interplanetary plasma (density, speed, temperature) measured in situ at the Lagrangian point L1 by ACE.
Other modules that will provide other products in real time (such as the occurrence of solar flares or eruptions, or the distribution on the solar disk of regions potentially of interest for space weather) will be activated in the next developments of the project.
SWELTO is a “think tank” where new data analysis methods, numerical models, measurements, and ideas of interest for Space Weather are developed and tested. The project is currently fully supported by the INAF-Turin Observatory.
For more information please contact alessandro.bemporad@inaf.it or download the technical note describing the project in details (https://openaccess.inaf.it/handle/20.500.12386/27715).
A Preliminary Risk Assessment of Geomagnetically Induced Currents over the Italian Territory
Papers from SWICo members
Authors:
Roberta Tozzi, Paola De Michelis, Igino Coco, Fabio Giannattasio
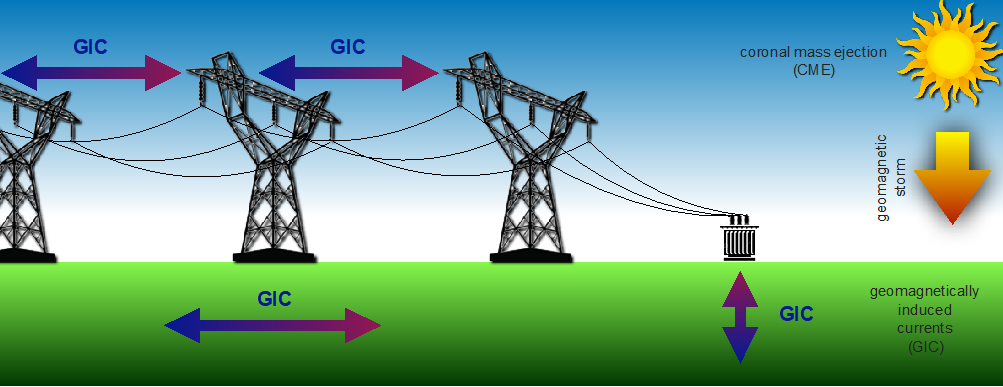
Major geomagnetic storms drive rapid intensification and variability of magnetospheric and ionospheric current systems that give rise to large ground geomagnetically-induced currents (GIC). Space weather associated GIC pose a serious threat to the reliability of power-transmission systems and other electrically conducting infrastructures such as oil and gas pipelines. The most severe effects are observed at high latitudes due to ionospheric currents associated with the aurora. However, as power transmission grid and pipeline infrastructures continue to grow at middle and low-latitudes, GIC hazards are no longer just concerns of high-latitude regions.
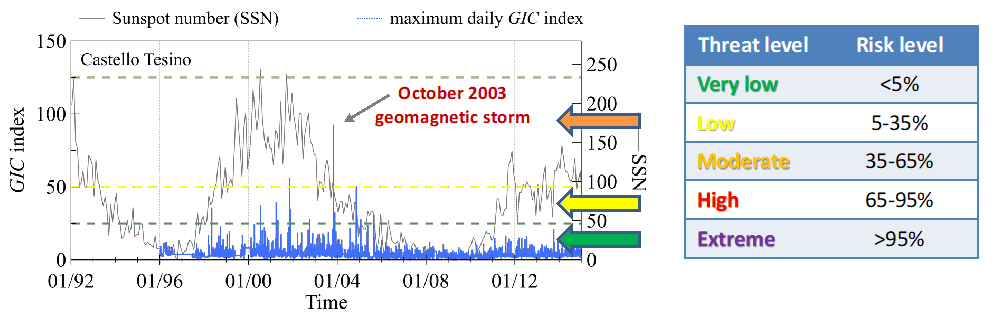
We provide a preliminary characterisation of the general risk to which the Italian power grid network is exposed. Due to limited direct GIC measurements, a proxy of the geoelectric field is used, i.e. the GIC index. This is calculated for a time interval of approximately 20 years using data from the two longest running Italian magnetic observatories, i.e. Castello Tesino and L’Aquila. Results show that during periods of high geomagnetic activity, potentially detrimental GICs could flow through the power network, especially at the highest Italian latitudes that are characterized by a low conductivity lithosphere.
Publication: Tozzi, R., De Michelis, P., Coco, I., Giannattasio, F., 2019. A Preliminary Risk Assessment of Geomagnetically Induced Currents over the Italian Territory, Space Weather, 17, 46-58, doi: 10.1029/2018SW002065. https://agupubs.onlinelibrary.wiley.com/doi/full/10.1029/2018SW002065
More information:
http://www.lescienze.it/news/2011/08/11/news/il_ritorno_della_grande_aurora-551058/
https://www.swpc.noaa.gov/content/education-and-outreach
Single-spacecraft Identification of Flux Tubes and Current Sheets in the Solar Wind
Papers from SWICo members
Authors:
F. Pecora, A. Greco, Q. Hu, S. Servidio, A. Chasapis, W. H. Matthaeus
In this work we present a novel technique, based on two consolidated models, for describing and visualising the local topology of the magnetic field solar wind using single-spacecraft data. The Grad-Shafranov (GS) reconstruction method provides a two-dimensional map of the magnetic field surrounding the spacecraft trajectory, while the Partial Variance of Increments (PVI) technique is able to identify coherent magnetic structures, such as current sheets. We applied this combined technique to one month of magnetic field data measured by Wind satellite at 1 AU. In this stream we selected the flux rope events, that are structures with cylindrical symmetry and a relatively strong magnetic field along the symmetry axis. These flux tubes are quite large structures (a fraction of AU) and have a complex inner structure and they interact each other while moving in the Solar Wind.
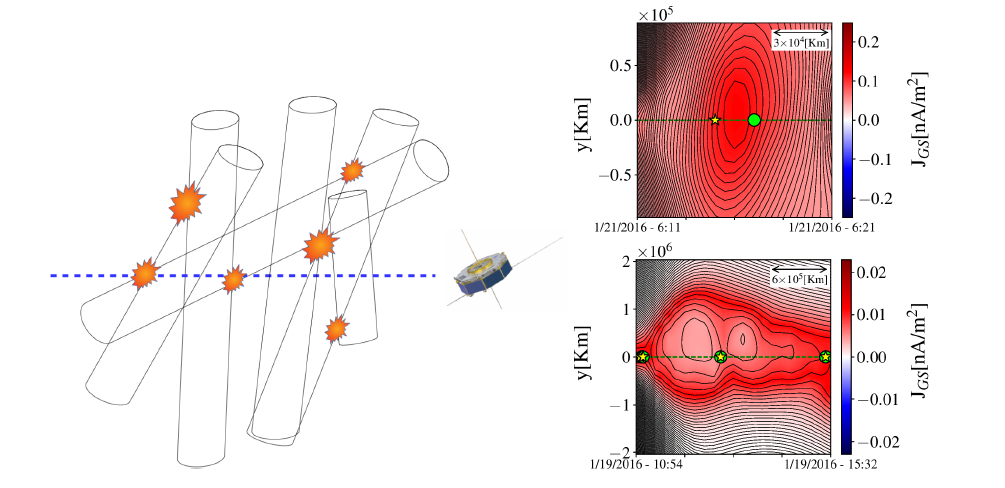
These inner and outer interactions can possibly generate sites of magnetic reconnection where strong current sheets appear. What we observed from the reconstruction is that a quasi-two-dimensional turbulence emerges as a sea of nested magnetic islands with current sheets located mostly at their boundaries. The method shows great promise for visualising and analysing single-spacecraft data from missions such as Parker Solar Probe and Solar Orbiter, as well as 1 AU SpaceWeather monitors such as ACE, Wind, and IMAP.
Publication: Pecora F., Greco A., Hu Q., Servidio S., Chasapis A. G., Matthaeus W. H., 2019, ApJL, 881, L11. doi:10.3847/2041-8213/ab32d9
https://iopscience.iop.org/article/10.3847/2041-8213/ab32d9