The Tor Vergata Synoptic Solar Telescope (TSST): A robotic, compact facility for solar full disk imaging
Papers from SWICo members
Luca Giovannelli, Francesco Berrilli, Daniele Calchetti, Dario Del Moro, Giorgio Viavattene, Ermanno Pietropaolo, Marco Iarlori, Vincenzo Rizi, Stuart Mark Jefferies, Maurizio Oliviero, Luciano Terranegra, Neil Murphy
By the continuous multi-line observation of the solar atmosphere, it is possible to infer the magnetic and dynamical status of the Sun. This activity is essential to identify the possible precursors of space weather events, such as flare or coronal mass ejections. We describe the design and assembly of TSST (Tor Vergata Synoptic Solar Telescope), a robotic synoptic telescope currently composed of two main full-disk instruments, a Hα telescope and a Potassium (KI D1) magneto-optical filter (MOF)-based telescope operating at 769.9 nm.
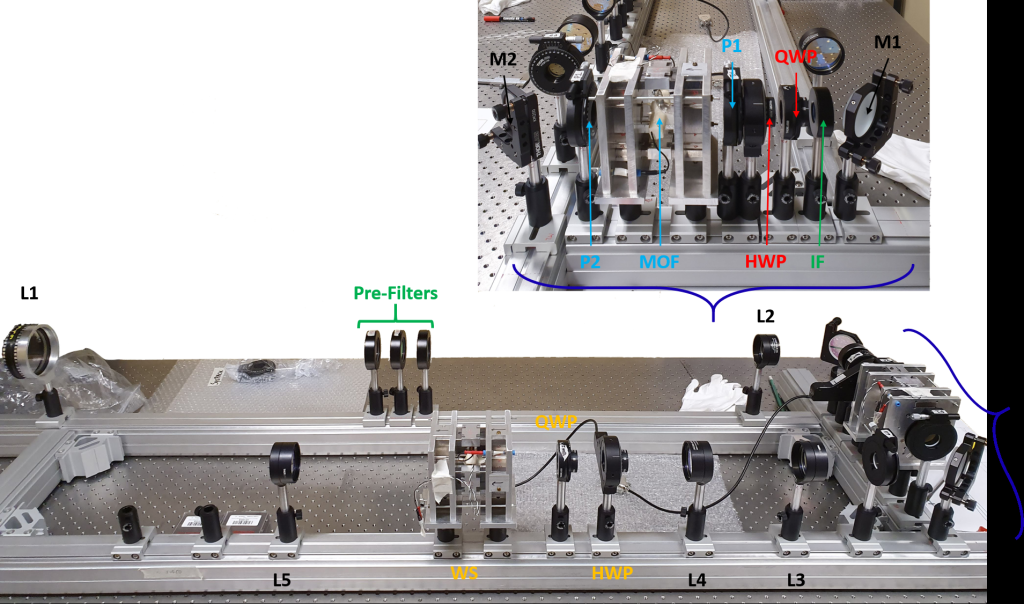
TSST is designed to be later upgraded with a second MOF channel. This paper describes the TSST concepts and presents the first light observation carried out in February 2020. We show that TSST is a low-cost robotic facility able to achieve the necessary data for the study of precursors of space weather events (using the magnetic and velocity maps by the MOF telescope) and fast flare detection (by the Hα telescope) to support Space Weather investigation and services.
Publications: Giovannelli L., Berrilli F., Calchetti D., Del Moro D., Viavattene G., Pietropaolo E., Iarlori M., et al., 2020, JSWSC, 10, 58. doi:10.1051/swsc/2020061. https://www.swsc-journal.org/articles/swsc/full_html/2020/01/swsc200063/swsc200063.html
Daniele Calchetti, Giorgio Viavattene, Luciano Terranegra, Ermanno Pietropaolo, Maurizio Oliviero, Neil Murphy, Start M. Jefferies, Luca Giovannelli, Dario Del Moro, and Francesco Berrilli, Proc. SPIE 11445, Ground-based and Airborne Telescopes VIII, 114452T (13 December 2020); https://doi.org/10.1117/12.2562454
Calchetti D, Viavattene G, Berrilli F, Del Moro D, Giovannelli L, Oliviero M. 2020. Journal of Physics Conference Series, Vol. 1548. https://doi.org/10.1088/1742-6596/1548/1/012005
Viavattene G, Calchetti D, Berrilli F, Del Moro D, Giovannelli L, Pietropaolo E, Oliviero M, Terranegra L. 2020. Il Nuovo
Ciment C (Ed.), Vol. 43 of Il Nuovo Cimento C, 120 p. https://doi.org/10.1393/ncc/i2020-20120-6
On the link between the topside ionospheric effective scale height and the plasma ambipolar diffusion, theory and preliminary results
Papers from SWICo members
A. Pignalberi, M. Pezzopane, B. Nava, P. Coïsson
Over the years, an amount of models relying on effective parameters were implemented in the challenging issue of the topside ionosphere description. These models are based on different analytical functions, but all of them depend on a parameter called effective scale height, that is deduced from topside electron density measurements. As their names state, they are effective in reproducing the topside electron density profile only when applied to the analytical function used to derive them. Then, in principle, they do not have any physical meaning. It is the goal of this paper to mathematically link the effective scale height modeled through the Epstein layer to the vertical scale height theoretically deduced from the plasma ambipolar diffusion theory.
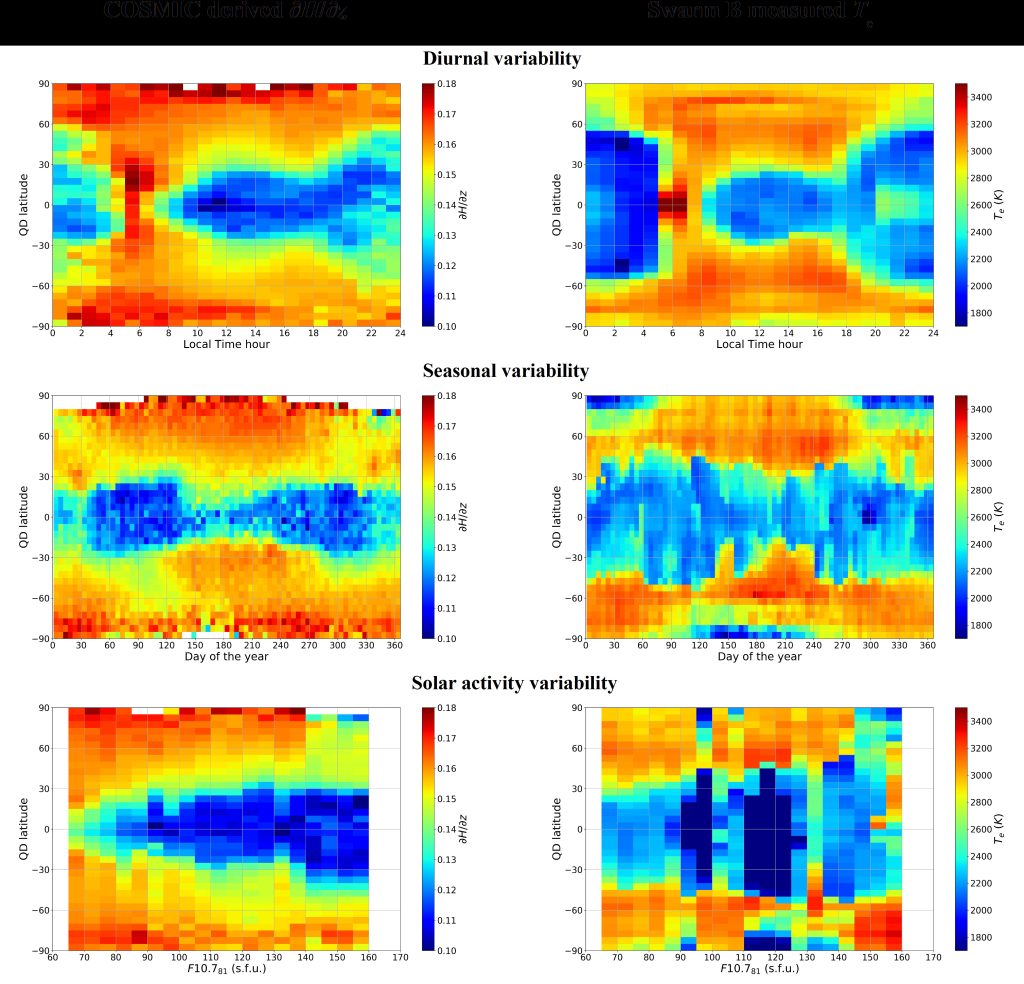
Firstly, effective and theoretical scale heights are linked through a mathematical relation by showing that they tend to each other in the topside ionosphere. Secondly, their connection is preliminarily demonstrated by calculating effective scale height values from the entire COSMIC/FORMOSAT-3 radio occultation dataset. Thirdly, a possible connection between the vertical gradient of the topside scale height (as obtained by COSMIC/FORMOSAT-3 satellites) and the electron temperature (as obtained by ESA Swarm B satellite) is studied by highlighting corresponding similarities in the diurnal, seasonal, solar activity, and latitudinal variability.
Publication: A. Pignalberi, M. Pezzopane, B. Nava, P. Coïsson, On the link between the topside ionospheric effective scale height and the plasma ambipolar diffusion, theory and preliminary results, Scientific Reports 10:17541, 2020. https://doi.org/10.1038/s41598-020-73886-4
Hints on the Multiscale Nature of Geomagnetic Field Fluctuations During Quiet and Disturbed Periods
Papers from SWICo members
L. Santarelli, P. De Michelis, G. Consolini
We analyse the short timescale fluctuations (τ < 200 min) of the magnetic signals recorded at 78 ground stations from 13 to 31 March 2015, focusing our attention on sources which are external to the Earth, that is, due to current systems flowing in the ionosphere and magnetosphere, and investigating their dependence on magnetic latitude, magnetic local time, and geomagnetic activity. We find that, at geomagnetic latitudes >|60°|, such fluctuations constitute more than 30% of the external magnetic field, and their maximum contribution occurs along the auroral oval suggesting that they are mainly triggered by the ionospheric electric current systems active in these regions.
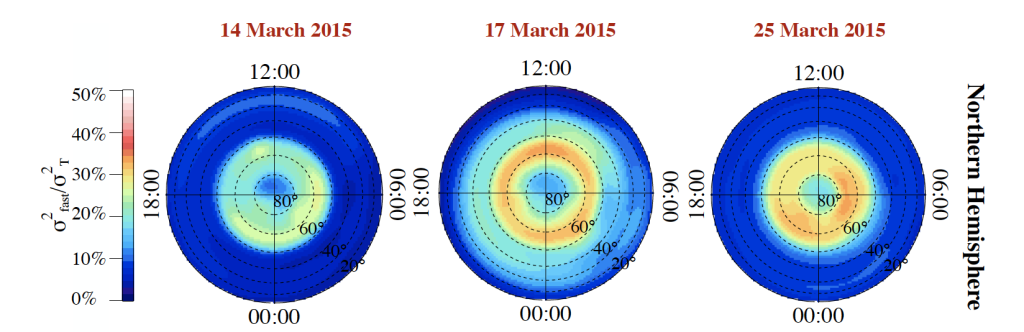
These short timescale magnetic fluctuations are very relevant in contributing to the prediction of geomagnetically induced currents in the auroral zones.
Publication: L. Santarelli, P. De Michelis, G. Consolini, Hints of the Multiscale Nature of Geomagnetic Field Fluctuations during Quiet and Disturbed Periods, J. Geophys. Res.: Space Physics, 126 (5), 2021. https://doi.org/10.1029/2020JA028596
Ionospheric Turbulence and the Equatorial Plasma Density Irregularities: Scaling Features and RODI
Papers from SWICo members
P. De Michelis, G. Consolini, R. Tozzi, A. Pignalberi, M. Pezzopane, I. Coco, F. Giannattasio, and M.F. Marcucci
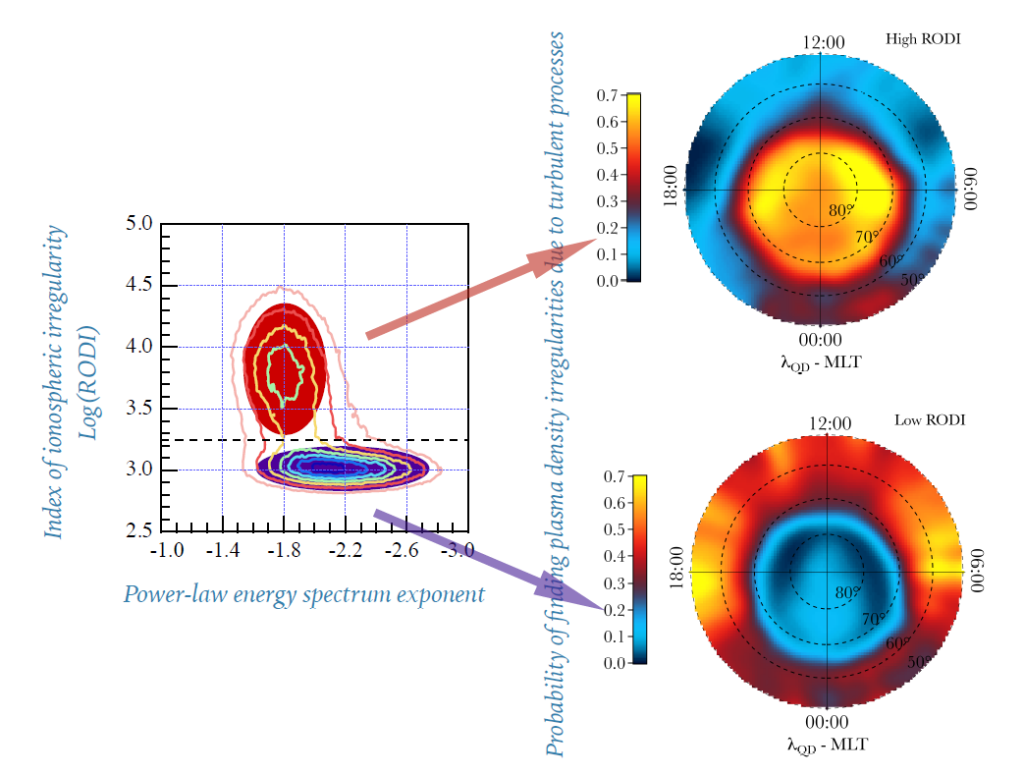
Equatorial plasma bubbles are ionospheric irregularities that usually occur after sunset and are characterized by strong density depletions. At the edges and inside the bubbles plasma turbulence processes are thought to take place, that are able to perturb electromagnetic signals crossing these regions, such as for example those from GNSS satellites. We investigated the relationship between the Rate Of change of electron Density Index (RODI) and the scaling features of the electron density during plasma bubbles crossings, as identified by 22 months of data of the Swarm A spacecraft (2014-2016).
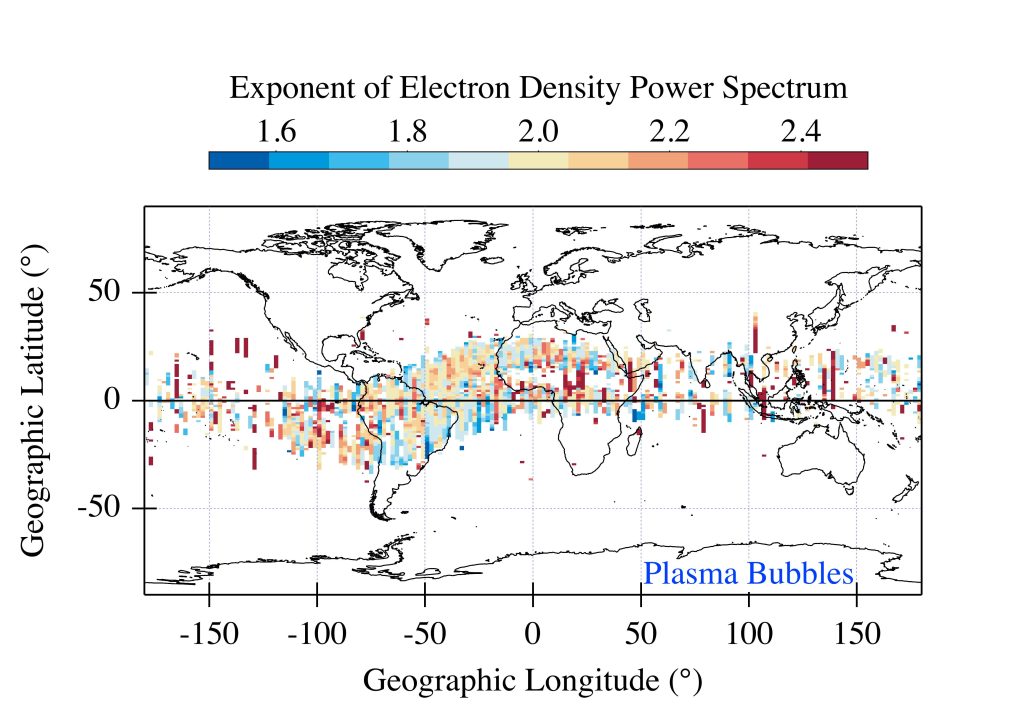
We found that plasma bubbles exhibit scaling properties, which are completely different from the surrounding environment and are associated with large density gradients. These large density gradients, which are certainly the result of the turbulent nature of the irregularities, are reflected in high RODI values. Therefore, RODI could be used as a proxy of those ionospheric irregularities which are characterized by a turbulent nature.
Publication: P.De Michelis, G. Consolini, R. Tozzi, A. Pignalberi, M. Pezzopane, I. Coco, F. Giannattasio, M. F. Marcucci, Ionospheric Turbulence and the Equatorial Plasma Density Irregularities: Scaling Features and RODI, Remote Sens., 13, 759, 2021. https://doi.org/10.3390/rs13040759
Looking for a proxy of the ionospheric turbulence with Swarm data
Papers from SWICo members
P. De Michelis, G. Consolini, A. Pignalberi, R. Tozzi, I. Coco, F. Giannattasio, M. Pezzopane, and G. Balasis.
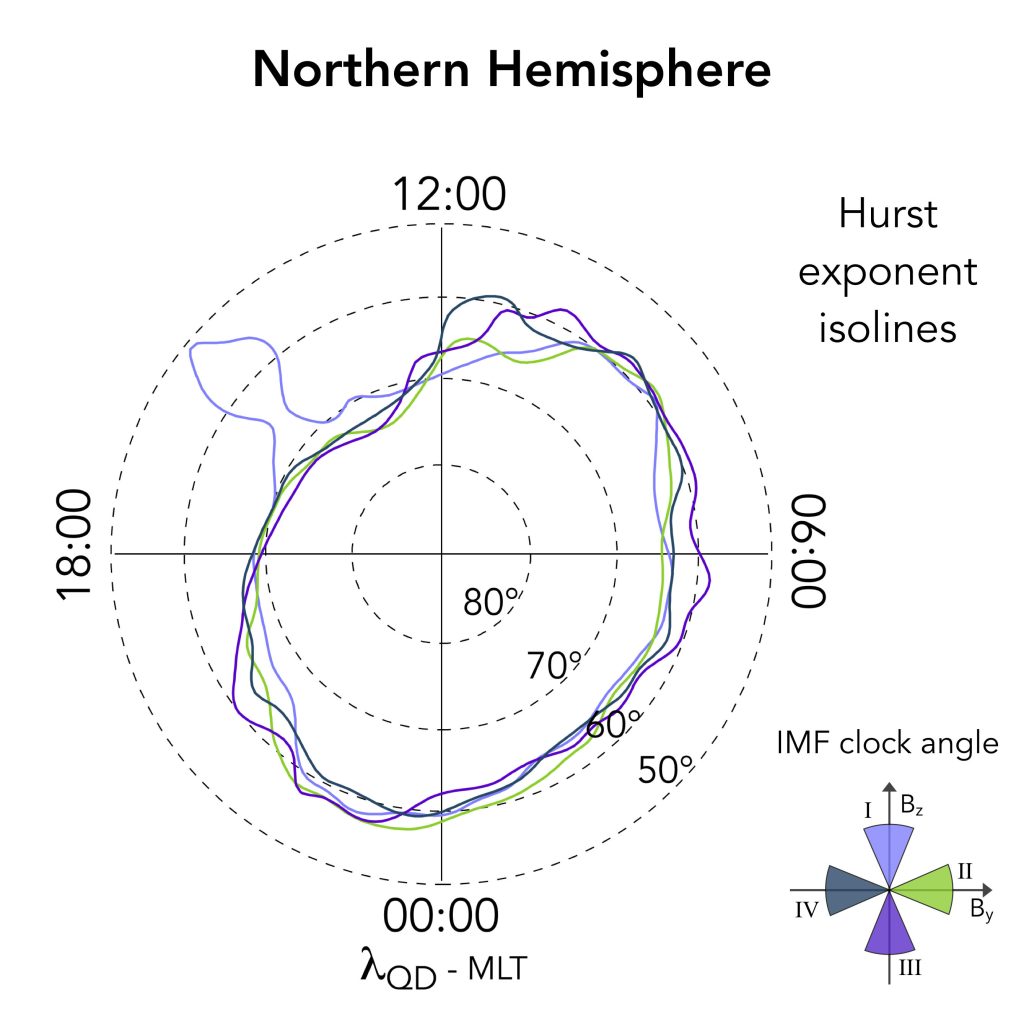
We selected about four years (April 2014-February 2018) of 1 Hz electron density measurements recorded on-board ESA Swarm A satellite, and we identified two different geomagnetic conditions according to the Auroral Electrojet (AE) index: quiet (AE<50 nT) and active (AE>300 nT). For both datasets, we evaluated the first- and second-order scaling exponents and an intermittency coefficient associated with the electron density fluctuations. Then, the joint probability distribution between each of these quantities and the rate of change of electron density index (RODI) was also evaluated.
We identified two families of plasma density fluctuations characterized by different mean values of both the scaling exponents and RODI, suggesting that different mechanisms (instabilities/turbulent processes) can be responsible for the observed scaling features. Furthermore, a clear different localization of the two families in the magnetic latitude – magnetic local time plane is found and its dependence on geomagnetic activity levels is analyzed. These results may well have a bearing about the capability of recognizing the turbulent character of irregularities using a typical ionospheric plasma irregularity index as a proxy.
Publication: P. De Michelis, G. Consolini, A. Pignalberi, R. Tozzi, I. Coco, F. Giannattasio, M. Pezzopane, and G. Balasis, Looking for a proxy of the ionospheric turbulence with Swarm data, Scientific Reports, 11, 6183, 2021. https://doi.org/10.1038/s41598-021-84985-1
High-latitude polar pattern of ionospheric electron density: Scaling features and IMF dependence
Papers from SWICo members
G. Consolini, R. Tozzi, P. De Michelis, I. Coco, F. Giannattasio, M. Pezzopane, M.F. Marcucci, and G. Balasis.
We used electron density measurements over a period of 15 months from April 1, 2014 to June 30, 2015, from ESA Swarm A satellite, and computed the related 1st and 2nd order scaling exponents of the q-th order structure function.
We mapped them as a function of magnetic latitude and local time for four main orientations of the Interplanetary Magnetic Field under conditions of high solar activity (average solar radio flux – F10.7 – index equal to 140 ± 30 sfu, during the considered period). On the whole, the found patterns of the electron density 1st and 2nd order scaling exponents suggest the occurrence of turbulence at the high latitudes.
Publication: G. Consolini, R. Tozzi, P. De Michelis, I. Coco, F. Giannattasio, M. Pezzopane, M.F. Marcucci, and G. Balasis, High-latitude polar pattern of ionospheric electron density: Scaling features and IMF dependence, Journal of Atmospheric and Solar-Terrestrial Physics, 2021. https://doi.org/10.1016/j.jastp.2020.105531
Parallel electrical conductivity in the topside ionosphere derived from Swarm measurements
Papers from SWICo members
F. Giannattasio, P. De Michelis, A. Pignalberi, I. Coco, G. Consolini, M. Pezzopane, and R. Tozzi.
About four years of plasma data (electron density and temperature) from the ESA Swarm A satellite has been used to compute the ionospheric electrical conductivity parallel to the geomagnetic field, with the purpose of climatologically characterize a fundamental parameter involved in the formation and evolution of the field aligned currents. Variations as a function of magnetic latitude, local time and season are examined and the average effect of particle precipitation is evaluated by subtraction of the background conductivity by using the IRI model.
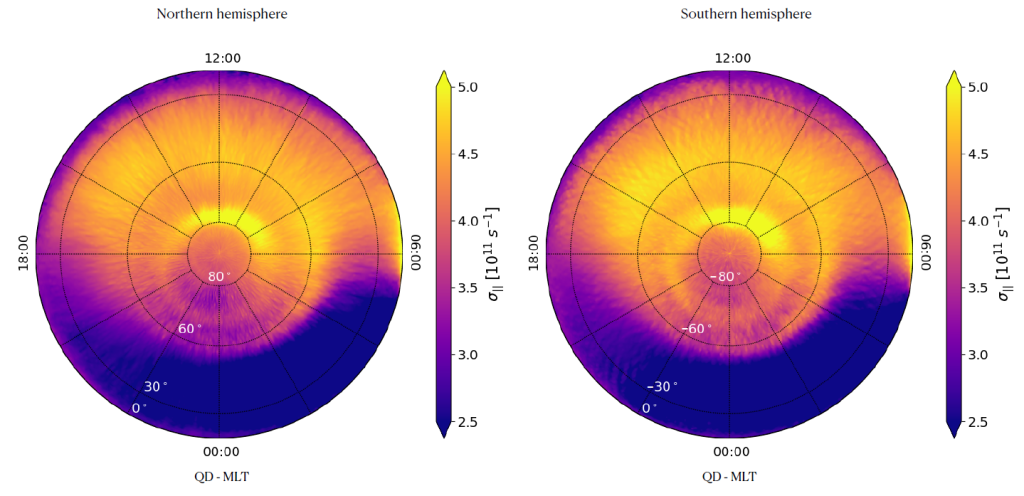
The results overall agree with previous literature, but also evidence interesting unexpected features, such as, for examples, marked asymmetries in the conductivity distributions between Northern and Southern hemispheres.
Publication: F. Giannattasio, P. De Michelis, A. Pignalberi, I. Coco, G. Consolini, M. Pezzopane, and R. Tozzi, Parallel electrical conductivity in the topside ionosphere derived from Swarm measurements, J. Geophys. Res.: Space Physics, 126(2), e2020JA028452, 2021. https://doi.org/10.1029/2020JA028452.
Forecasting SYM‐H Index: A Comparison Between Long Short‐Term Memory and Convolutional Neural Networks
Papers from SWICo members
F. Siciliano G. Consolini, R. Tozzi, M. Gentili, F. Giannattasio, and P. De Michelis.
Geomagnetic indices are proxies of the geomagnetic disturbances observed on the ground during geomagnetic storms and substorms. So, their forecasting represents a key point to develop warning systems for the mitigation of possible effects of severe geomagnetic storms on critical ground infrastructures. Here, we forecast SYM‐H index using two artificial neural network models based on two conceptually different networks: the Long Short‐Term Memory (LSTM) and the Convolutional Neural Network (CNN). Both networks are trained with two different sets of data: 1) interplanetary magnetic field (IMF) components and magnitude, and 2) interplanetary magnetic field components and magnitude and previous SYM‐H values. Specifically, we selected 42 geomagnetic storms among the most intense occurred between 1998 and 2018.
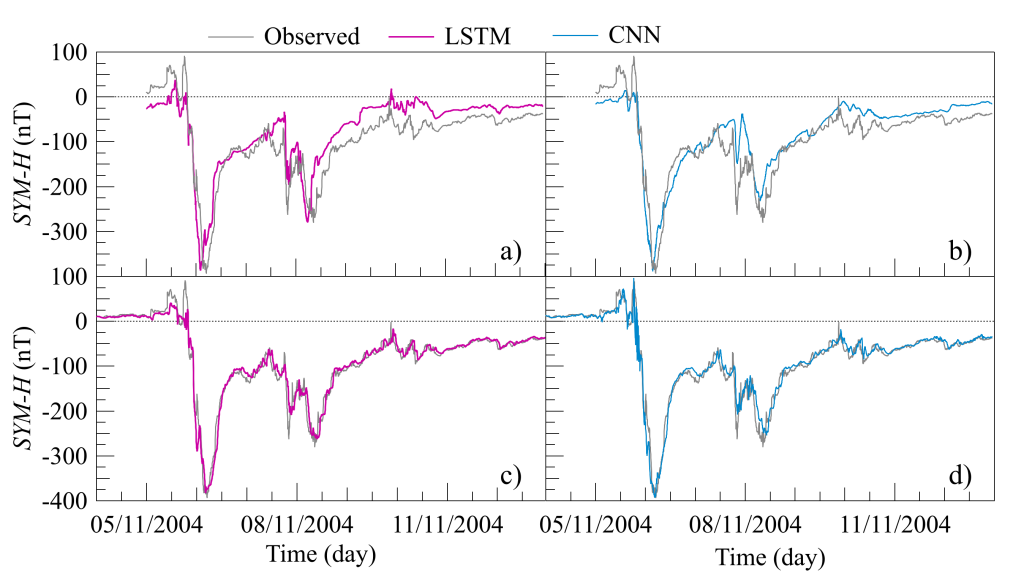
The performance of the two models has been compared thus pointing out the peculiarity of each model. In summary we have found that: 1) both networks are able to well forecast SYM‐H index 1 hour in advance, with values of the coefficient of determination R2 larger than 95%; 2) when using the data set that includes SYM-H index the model based on LSTM is slightly more accurate than that based on CNN; 3) differently, when using the data set consisting of IMF values only the model based on CNN displays a higher accuracy than that based on LSTM.
Publication: F. Siciliano G. Consolini R. Tozzi M. Gentili F. Giannattasio P. De Michelis, Forecasting SYM‐H Index: A Comparison Between Long Short‐Term Memory and Convolutional Neural Networks, Space Weather, 19 (2), 2021. https://doi.org/10.1029/2020SW002589
The Shipwreck of the Airship “Dirigibile Italia” in the 1928 Polar Venture: A Retrospective Analysis of the Ionospheric and Geomagnetic Conditions
Papers from SWICo members
B. Zolesi, M. Pezzopane, C. Bianchi, A. Meloni, Lj. R. Cander, and R. Tozzi.
On 25 May 1928, while coming back to the base in NyAlesund after having overflew the North Pole, the airship “Dirigibile Italia” shipwrecked on the ice‐pack in a region at about 400 km northeast of Svalbard Islands. Using a portable high frequency (HF) radio transmitter, survivors tried to send SOS messages and to establish a radio link with a ship closely anchored at King’s Bay, that is “Città di Milano” of the Italian Navy. All their attempts proved unsuccessful until a Russian radio amateur close to the town of Arkhangelsk about 1,900 km away succeeded in receiving the messages launched by the survivors and raised the alarm. This however happened only after 9 days of repeated radio‐distress transmissions.

This work provides a retrospective analysis of the ionospheric and geomagnetic conditions of those days to try to explain the HF radio communications problems experienced by the survivors. To this purpose, the International Reference Ionosphere model has been used, and early geomagnetic measurements have been analysed. We found that the HF transmission difficulties were associated with the “dead zone” of F‐region propagation but that they might have been exacerbated by solar and geomagnetically disturbed conditions of the days soon after the airship wreck.
Publication: B. Zolesi, M. Pezzopane, C. Bianchi, A. Meloni, Lj. R. Cander, and R. Tozzi, The Shipwreck of the Airship “Dirigibile Italia” in the 1928 Polar Venture: A Retrospective Analysis of the Ionospheric and Geomagnetic Conditions, Space Weather, 18, e2020SW002459, 2020. https://doi.org/10.1029/2020SW002459
The ESA Swarm mission to help ionospheric modeling: a new NeQuick topside formulation for mid-latitude regions
Papers from SWICo members
M. Pezzopane and A. Pignalberi.
The ionospheric topside representation made by the NeQuick model is improved by correcting the H0 parameter. This task is accomplished by fitting the NeQuick topside analytical function through the F2-layer absolute electron density maximum and the electron density value as measured by Swarm satellites from December 2013 to September 2018. The new NeQuick formulation is statistically validated by comparing modeled values to those derived from COSMIC/FORMOSAT-3 measured Radio Occultation profiles, and those measured by Swarm satellites.
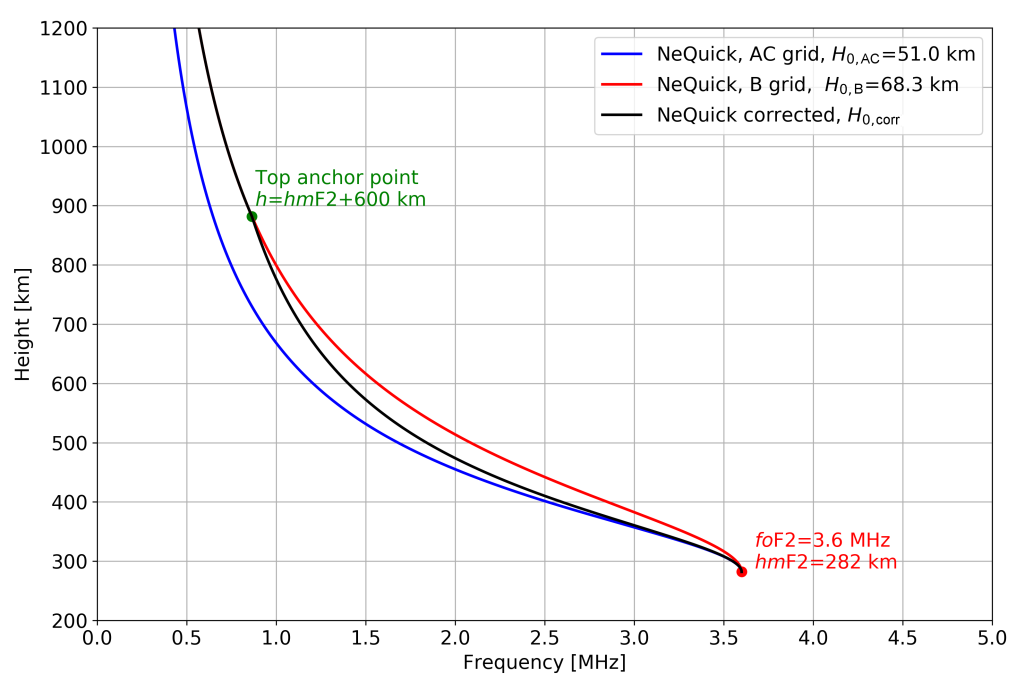
The results show that the proposed formulation is reliable and significantly improves the topside description made by the NeQuick model at mid latitudes, for both high and low solar activities. This means that this new formulation might be proposed as an additional topside option for the International Reference Ionosphere model.
Publication: M. Pezzopane and A. Pignalberi, The ESA Swarm mission to help ionospheric modeling: a new NeQuick topside formulation for mid-latitude regions, Scientific Reports, 9, 12253, 2019. https://doi.org/10.1038/s41598-019-48440-6